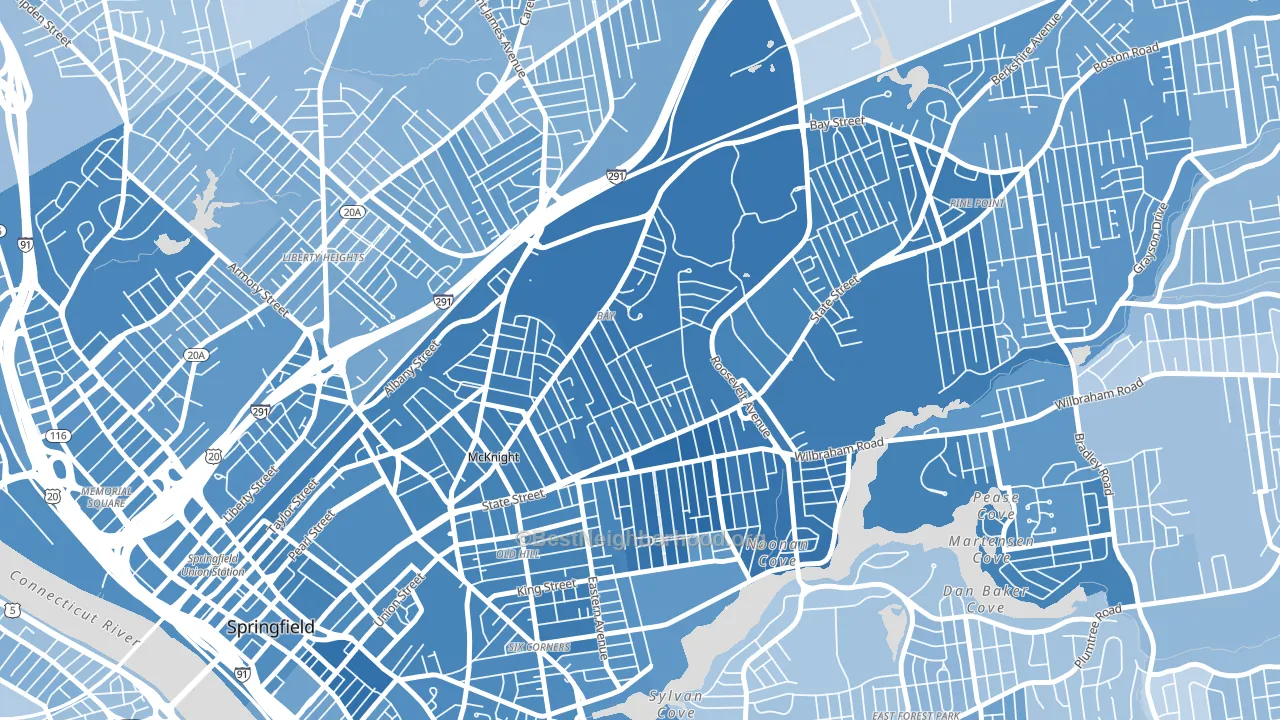
Bay is a Democratic stronghold. About 78% of voters here vote Democratic and 22% Republican.
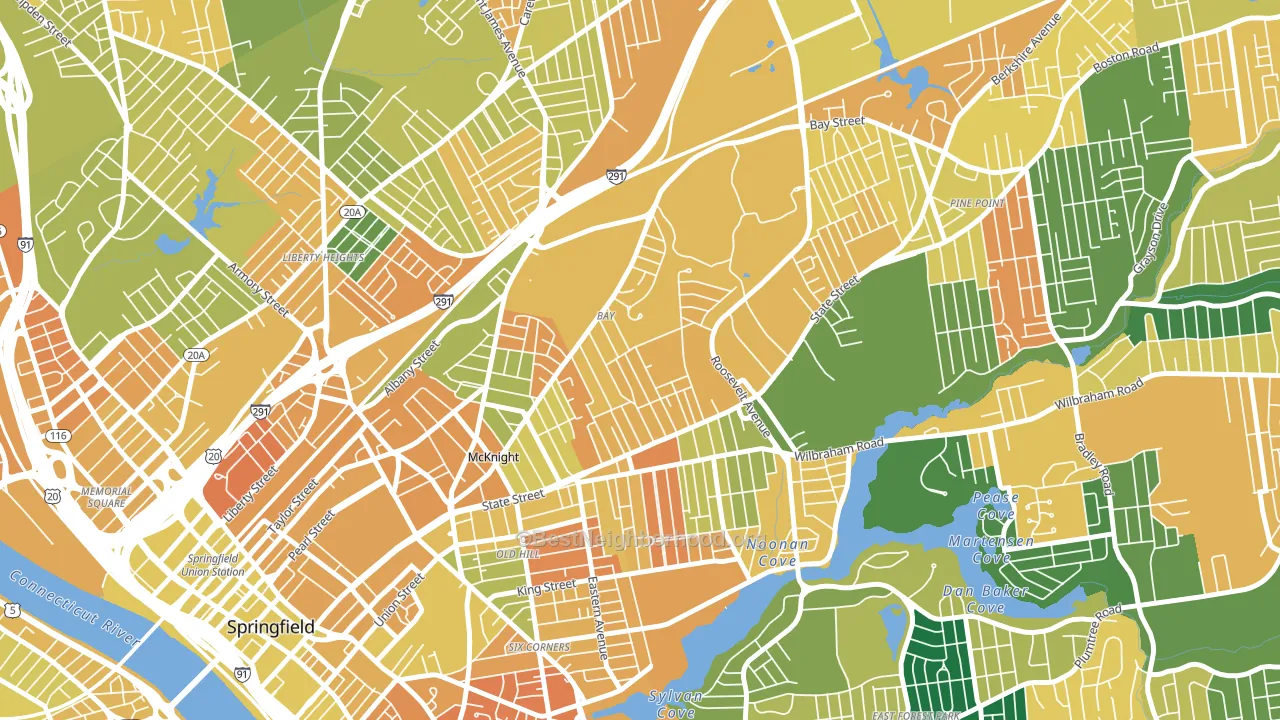
About 37% of adults in Bay typically vote, below the U.S. average of about 62%. Among adults in Bay, ~29% vote Democratic, ~8% Republican, and ~63% don't vote. The map below shows estimated turnout by block group.
How Bay compares
Among neighborhoods within 5 miles, Bay leans more Democratic than 14 of 15 neighbors.
Bay runs about 31 points more Democratic than Massachusetts as a whole.
Why Bay leans the way it does
This analysis examined 14,881 data points per neighborhood to find what predicts political lean and turnout. The items below are a few correlations that stood out for Bay, not a ranked or complete list of what matters most.
Areas with many never-married adults vote Democratic. About 61% of adults in Bay have never been married, modestly above similar-sized neighborhoods (around 52%).
Cancer-screening access and voter turnout
Places with low colon-cancer-screening access tend to turn out at a lower rate; Bay, Springfield, MA sits in the bottom tenth nationally on this measure. Cancer screening does not drive turnout; it reflects income, insurance, and healthcare access.
Why turnout in Bay looks the way it does
Areas with limited routine healthcare access turn out at lower rates. Bay is in the bottom quarter nationally for routine-care measures such as insurance coverage, preventive screenings, and dental visits. The dental-visit rate here is about 48%, about 24 points below the Massachusetts average of 72%. High food insecurity lines up with lower turnout, and about 45% of adults in Bay report food insecurity, above 97% of neighborhoods. Low high-school completion lines up with lower turnout, and about 70% of adults in Bay have completed high school, below 94% of neighborhoods. Learn more about the findings and methodology on the political spectrum map.
Nearby Neighborhoods
- McKnight, Springfield, MA D+55
- Upper Hill, Springfield, MA D+65
- Old Hill, Springfield, MA D+55
- Liberty Heights, Springfield, MA D+34
- Maple High-Six Corners, Springfield, MA D+44
- Pine Point, Springfield, MA D+41
- Metro Center, Springfield, MA D+44
- East Springfield, Springfield, MA D+19
- South End Springfield, Springfield, MA D+40
- East Forest Park, Springfield, MA D+22
Neighborhoods with Similar Populations
- Loch Raven Manor, Towson, MD D+46
- Lytle Creek, San Bernardino, CA D+26
- Dutchtown, Rochester, NY D+56
- Sylvan Park, Nashville, TN D+38
- Rincon Heights, Tucson, AZ D+57
- Bayside, Queens, NY D+9
- Old Town-Chinatown, Portland, OR D+54
- Old Hill, Springfield, MA D+55
- South Salt Creek, Lincoln, NE D+29
- Zach White, El Paso, TX Even
Sources and methodology
Precinct-level voting records used to fit the model come from Massachusetts Secretary of the Commonwealth, Elections, distributed by the Voting and Election Science Team. Demographic inputs come from the U.S. Census Bureau (ACS 5-year estimates and the 2020 Decennial Census). Health and environmental inputs come from the CDC (PLACES and the Environmental Justice Index). Land cover comes from the USGS and EPA. Election-day and lead-up weather come from PRISM 4km daily grids and the NOAA Global Historical Climatology Network. Mail-voting and election-administration patterns come from the MIT Election Lab's Survey of the Performance of American Elections. Block-group crime detail comes from CrimeGrade. Internet data and modeling support provided by ISPreports.org.
Modeling and analysis by the BestNeighborhood data science team. Full methodology and findings: political spectrum map.
Methodology reviewed by the BestNeighborhood data team. Last updated May 2026.