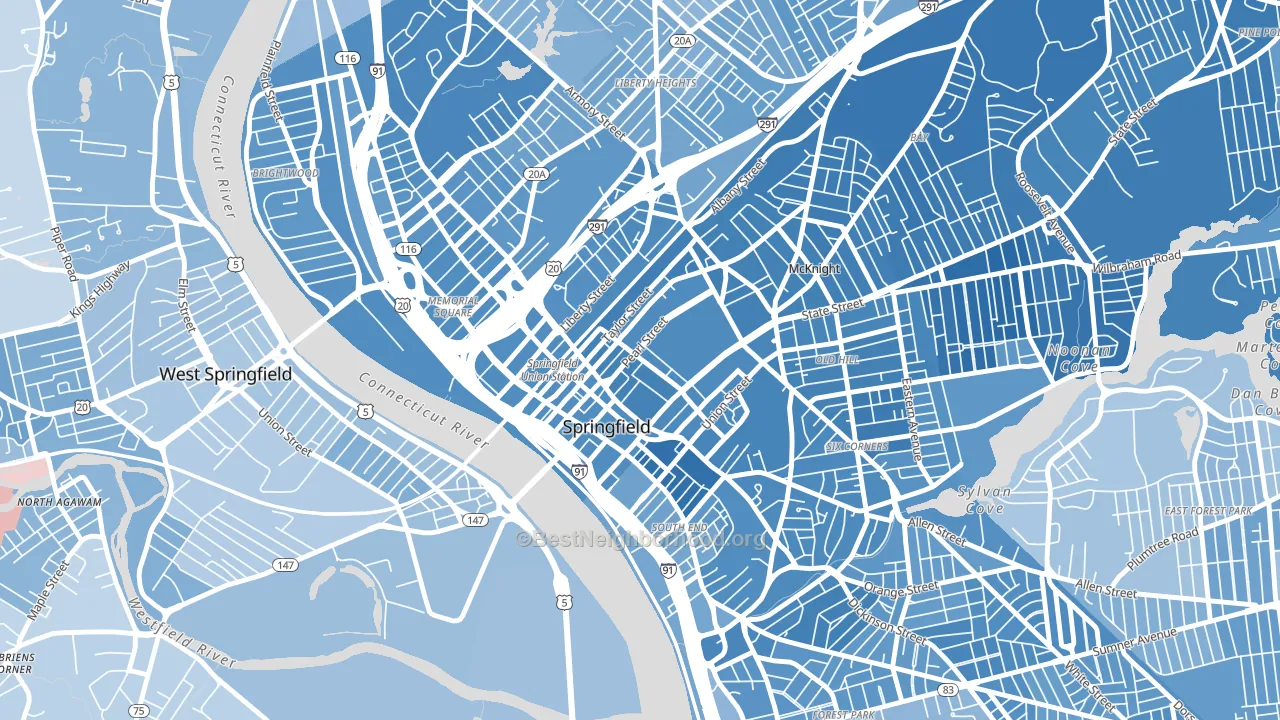
Metro Center leans heavily Democratic by roughly 44 points: about 72% of voters vote Democratic and 28% Republican.
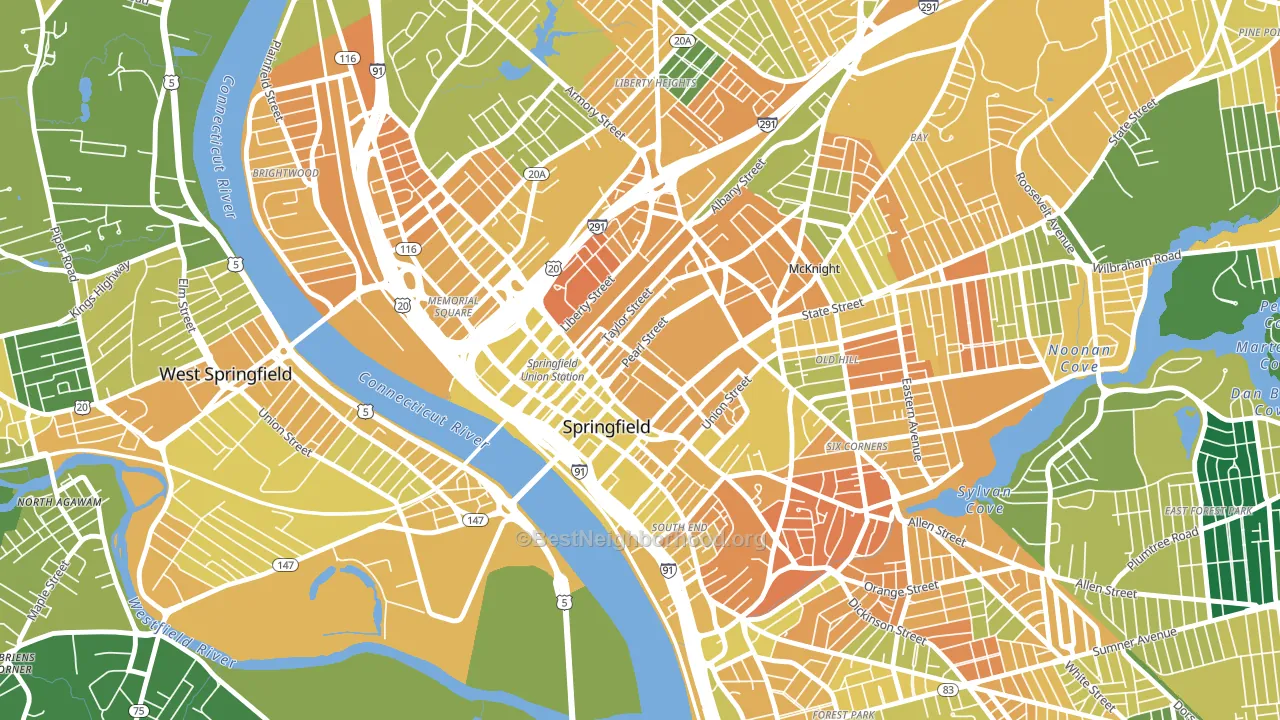
About 34% of adults in Metro Center typically vote, below the U.S. average of about 62%. Among adults in Metro Center, ~24% vote Democratic, ~10% Republican, and ~66% don't vote. The map below shows estimated turnout by block group.
How Metro Center compares
Among neighborhoods within 5 miles, Metro Center leans more Democratic than 11 of 15 neighbors.
Metro Center runs about 19 points more Democratic than Massachusetts as a whole.
Why Metro Center leans the way it does
This analysis examined 14,881 data points per neighborhood to find what predicts political lean and turnout. The items below are a few correlations that stood out for Metro Center, not a ranked or complete list of what matters most.
Areas with many never-married adults vote Democratic. About 66% of adults in Metro Center have never been married, well above similar-sized neighborhoods (around 42%).
Population density and Democratic lean
Places with high population density tend to lean Democratic; Metro Center, Springfield, MA sits in the top tenth nationally on this measure.
Why turnout in Metro Center looks the way it does
Areas with limited routine healthcare access turn out at lower rates. Metro Center is in the bottom quarter nationally for routine-care measures such as insurance coverage, preventive screenings, and dental visits. The dental-visit rate here is about 43%, about 29 points below the Massachusetts average of 72%. Renters vote less often than owners, and about 93% of households in Metro Center rent, compared to around 67% in nearby neighborhoods. High food insecurity lines up with lower turnout, and about 51% of adults in Metro Center report food insecurity, in the top fraction of neighborhoods. Learn more about the findings and methodology on the political spectrum map.
Nearby Neighborhoods
- South End Springfield, Springfield, MA D+40
- Maple High-Six Corners, Springfield, MA D+44
- McKnight, Springfield, MA D+55
- Old Hill, Springfield, MA D+55
- Memorial Square, Springfield, MA D+42
- Liberty Heights, Springfield, MA D+34
- Bay, Springfield, MA D+56
- Brightwood, Springfield, MA D+34
- Upper Hill, Springfield, MA D+65
- Forest Park, Springfield, MA D+37
Neighborhoods with Similar Populations
- Kirkwood, Coralville, IA D+52
- East English Village, Detroit, MI D+83
- Hickory Ridge, Charlotte, NC D+53
- Cedar Hills, Cedar Rapids, IA D+20
- Walteria, Torrance, CA D+19
- Elvira, Summit, AZ D+40
- Avondale, Jacksonville, FL D+21
- Old Seminol Heights, Tampa, FL D+36
- Crescent Hill, Louisville, KY D+46
- Avalon Highlands, Chicago, IL D+84
Sources and methodology
Precinct-level voting records used to fit the model come from Massachusetts Secretary of the Commonwealth, Elections, distributed by the Voting and Election Science Team. Demographic inputs come from the U.S. Census Bureau (ACS 5-year estimates and the 2020 Decennial Census). Health and environmental inputs come from the CDC (PLACES and the Environmental Justice Index). Land cover comes from the USGS and EPA. Election-day and lead-up weather come from PRISM 4km daily grids and the NOAA Global Historical Climatology Network. Mail-voting and election-administration patterns come from the MIT Election Lab's Survey of the Performance of American Elections. Block-group crime detail comes from CrimeGrade. Internet data and modeling support provided by ISPreports.org.
Modeling and analysis by the BestNeighborhood data science team. Full methodology and findings: political spectrum map.
Methodology reviewed by the BestNeighborhood data team. Last updated May 2026.