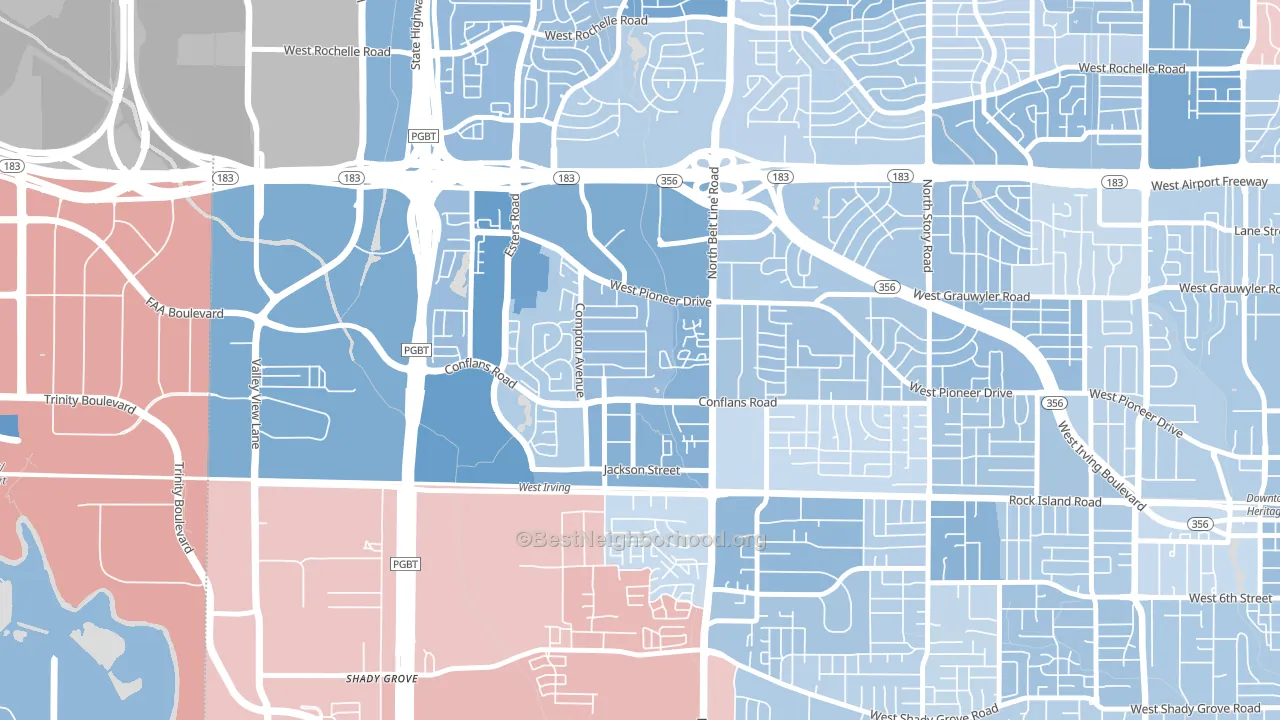
Bear Creek leans Democratic by roughly 22 points: about 61% of voters vote Democratic and 39% Republican.
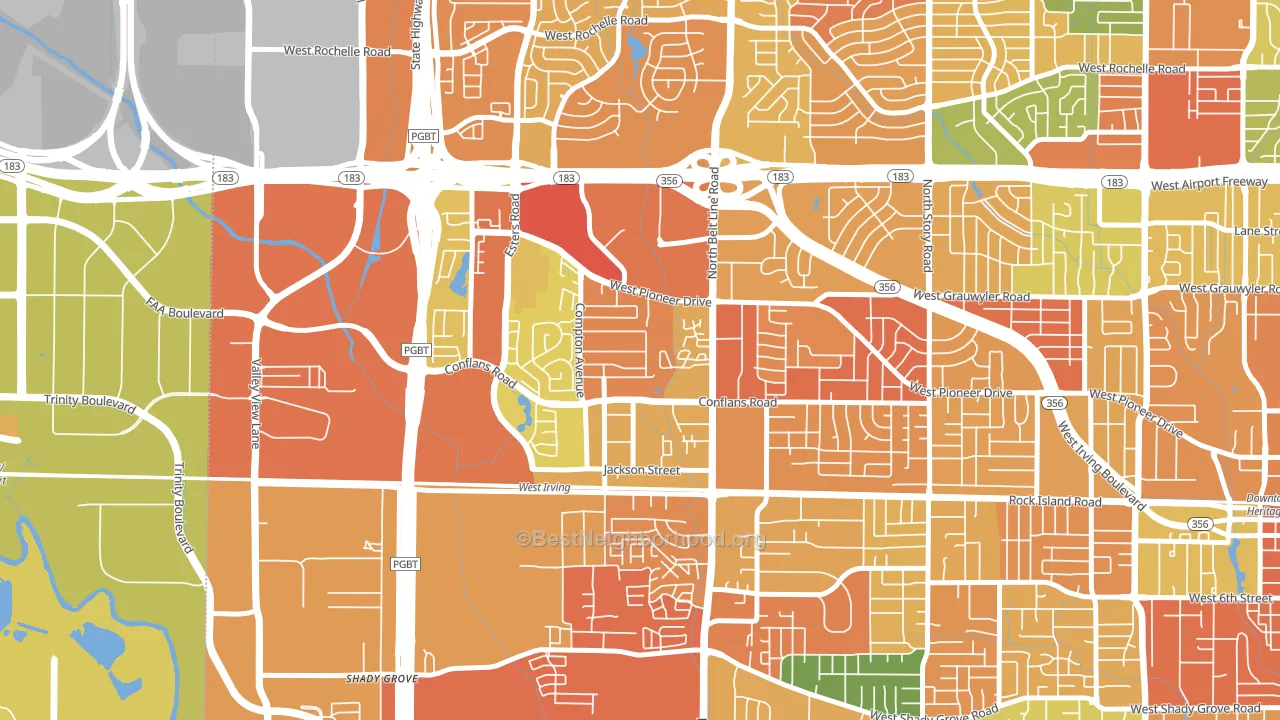
About 25% of adults in Bear Creek typically vote, below the U.S. average of about 62%. Among adults in Bear Creek, ~15% vote Democratic, ~10% Republican, and ~75% don't vote. The map below shows estimated turnout by block group.
How Bear Creek compares
Bear Creek runs about 35 points more Democratic than Texas as a whole. Texas leans Republican overall, while Bear Creek is one of the few Democratic-leaning pockets.
Politics vary noticeably by block within Bear Creek. The north side is the most Democratic-leaning (D+32) and the south side is the least Democratic-leaning (D+4), a spread of about 28 points.
Why Bear Creek leans the way it does
This analysis examined 14,881 data points per neighborhood to find what predicts political lean and turnout. The items below are a few correlations that stood out for Bear Creek, not a ranked or complete list of what matters most.
Dense areas vote Democratic. More than 99% of residents in Bear Creek live in densely developed areas, about 64 points above the U.S. average of 36%. Bear Creek runs against the grain of Texas, a Democratic-leaning pocket in a Republican-leaning state.
Paved land cover and Democratic lean
Places with extensive paved surfaces tend to lean Democratic; Bear Creek, Irving, TX sits in the top quarter nationally on this measure. Paved ground does not change how people vote; it mostly reflects how urban and built-up a place is.
Why turnout in Bear Creek looks the way it does
Areas with limited routine healthcare access turn out at lower rates. Bear Creek is in the bottom quarter nationally for routine-care measures such as insurance coverage, preventive screenings, and dental visits. The dental-visit rate here is about 44%, about 10 points below the Texas average of 54%. Low high-school completion lines up with lower turnout, and about 68% of adults in Bear Creek have completed high school, below 96% of neighborhoods. Learn more about the findings and methodology on the political spectrum map.
Nearby Neighborhoods
- Song, Irving, TX D+33
- Indian Hills, Grand Prairie, TX D+10
- North Arlington, Arlington, TX D+28
- Valley Ranch, Irving, TX D+20
- Eagle Ford, Dallas, TX D+47
- Love Field Area, Dallas, TX D+36
- Mosier Valley, Euless, TX D+3
- Central Arlington, Arlington, TX D+25
- Winnetka Heights, Dallas, TX D+36
- East Arlington, Arlington, TX D+22
Neighborhoods with Similar Populations
- Hope, Providence, RI D+78
- Third World, San Antonio, TX D+29
- Pyne Poynt, Camden, NJ D+61
- North University, Austin, TX D+72
- Plaza Midwood, Charlotte, NC D+40
- Bayfront, Erie, PA D+34
- Queen Anne Park, Teaneck, NJ D+34
- Colonial Place Riverview, Norfolk, VA D+61
- Orchard Park, Wichita, KS R+9
- University Center, Atlanta, GA D+88
Sources and methodology
Precinct-level voting records used to fit the model come from Texas Secretary of State, Elections Division, distributed by the Voting and Election Science Team. Demographic inputs come from the U.S. Census Bureau (ACS 5-year estimates and the 2020 Decennial Census). Health and environmental inputs come from the CDC (PLACES and the Environmental Justice Index). Land cover comes from the USGS and EPA. Election-day and lead-up weather come from PRISM 4km daily grids and the NOAA Global Historical Climatology Network. Mail-voting and election-administration patterns come from the MIT Election Lab's Survey of the Performance of American Elections. Block-group crime detail comes from CrimeGrade. Internet data and modeling support provided by ISPreports.org.
Modeling and analysis by the BestNeighborhood data science team. Full methodology and findings: political spectrum map.
Methodology reviewed by the BestNeighborhood data team. Last updated May 2026.