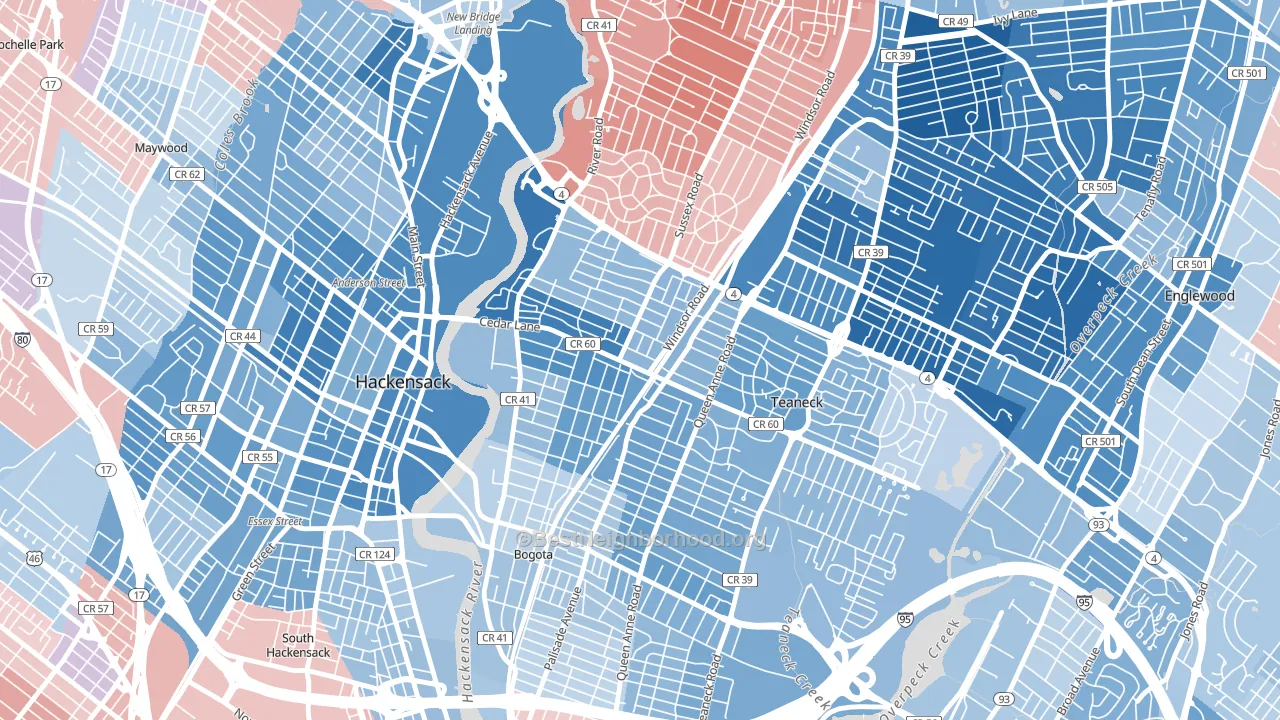
Queen Anne Park leans heavily Democratic by roughly 34 points: about 67% of voters vote Democratic and 33% Republican.
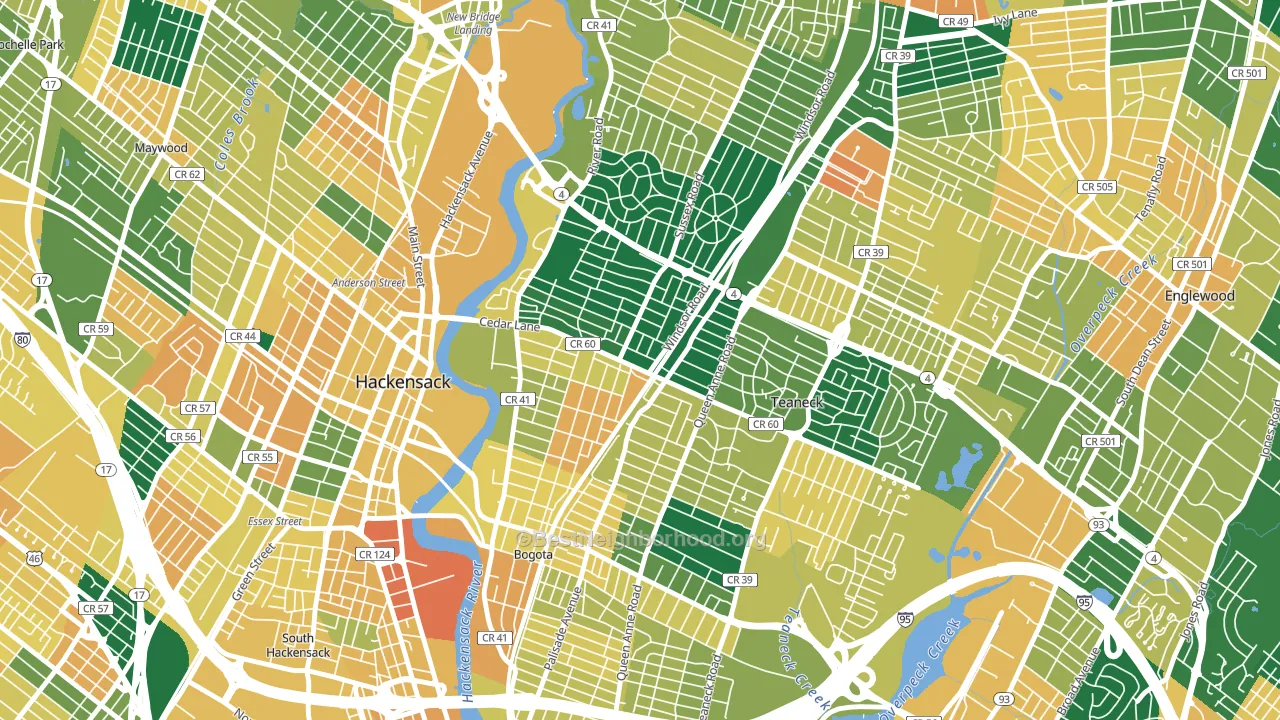
About 82% of adults in Queen Anne Park typically vote, above the U.S. average of about 62%. Among adults in Queen Anne Park, ~55% vote Democratic, ~27% Republican, and ~18% don't vote. The map below shows estimated turnout by block group.
How Queen Anne Park compares
Among neighborhoods within 5 miles, Queen Anne Park leans more Democratic than 7 of 8 neighbors.
Queen Anne Park runs about 29 points more Democratic than New Jersey as a whole.
Politics vary noticeably by block within Queen Anne Park. The west side is the most Democratic-leaning (D+43) and the north side is the least Democratic-leaning (D+29), a spread of about 13 points.
Why Queen Anne Park leans the way it does
This analysis examined 14,881 data points per neighborhood to find what predicts political lean and turnout. The items below are a few correlations that stood out for Queen Anne Park, not a ranked or complete list of what matters most.
Areas with high college attainment vote Democratic. About 61% of adults in Queen Anne Park hold a bachelor's degree, about 32 points above the U.S. average of 28%.
Population density and Democratic lean
Places with high population density tend to lean Democratic; Queen Anne Park, Teaneck, NJ sits in the top quarter nationally on this measure.
Why turnout in Queen Anne Park looks the way it does
Areas with strong routine healthcare access turn out at higher rates. Queen Anne Park is in the top quarter nationally for routine-care measures such as insurance coverage, preventive screenings, and dental visits. The dental-visit rate here is about 72%, about 12 points above the U.S. average of 60%. Learn more about the findings and methodology on the political spectrum map.
Nearby Neighborhoods
- Colonial Village, Teaneck, NJ D+29
- West Englewood, Teaneck, NJ D+56
- Surrey Lane, Bergenfield, NJ R+22
- Pleasant Acres, New Milford, NJ Even
- Linwood, Fort Lee, NJ D+22
- Koreatown, Palisades Park, NJ D+5
- Coytesville, Fort Lee, NJ D+17
- Passaic Junction, Saddle Brook, NJ R+18
- Warren Point, Fair Lawn, NJ Even
- Washington Heights, Manhattan, NY D+49
Neighborhoods with Similar Populations
- Bayfront, Erie, PA D+34
- Monument Street, Baltimore, MD D+14
- Pyne Poynt, Camden, NJ D+61
- Bear Creek, Irving, TX D+22
- Gresham-Northeast, Gresham, OR D+10
- Hope, Providence, RI D+78
- Third World, San Antonio, TX D+29
- Forest Ridge-Quail Hollow, Dayton, OH R+5
- North University, Austin, TX D+72
- Plaza Midwood, Charlotte, NC D+40
Sources and methodology
Precinct-level voting records used to fit the model come from New Jersey Division of Elections, distributed by the Voting and Election Science Team. Demographic inputs come from the U.S. Census Bureau (ACS 5-year estimates and the 2020 Decennial Census). Health and environmental inputs come from the CDC (PLACES and the Environmental Justice Index). Land cover comes from the USGS and EPA. Election-day and lead-up weather come from PRISM 4km daily grids and the NOAA Global Historical Climatology Network. Mail-voting and election-administration patterns come from the MIT Election Lab's Survey of the Performance of American Elections. Block-group crime detail comes from CrimeGrade. Internet data and modeling support provided by ISPreports.org.
Modeling and analysis by the BestNeighborhood data science team. Full methodology and findings: political spectrum map.
Methodology reviewed by the BestNeighborhood data team. Last updated May 2026.