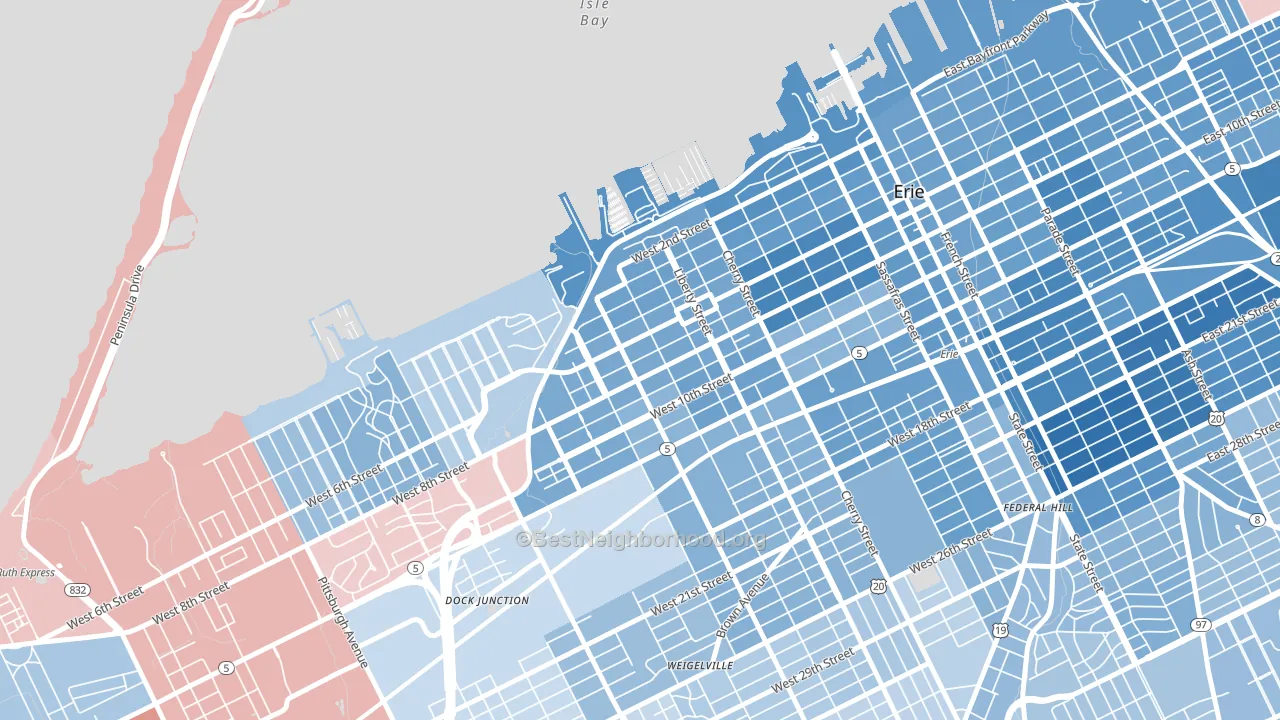
Bayfront leans heavily Democratic by roughly 34 points: about 67% of voters vote Democratic and 33% Republican.
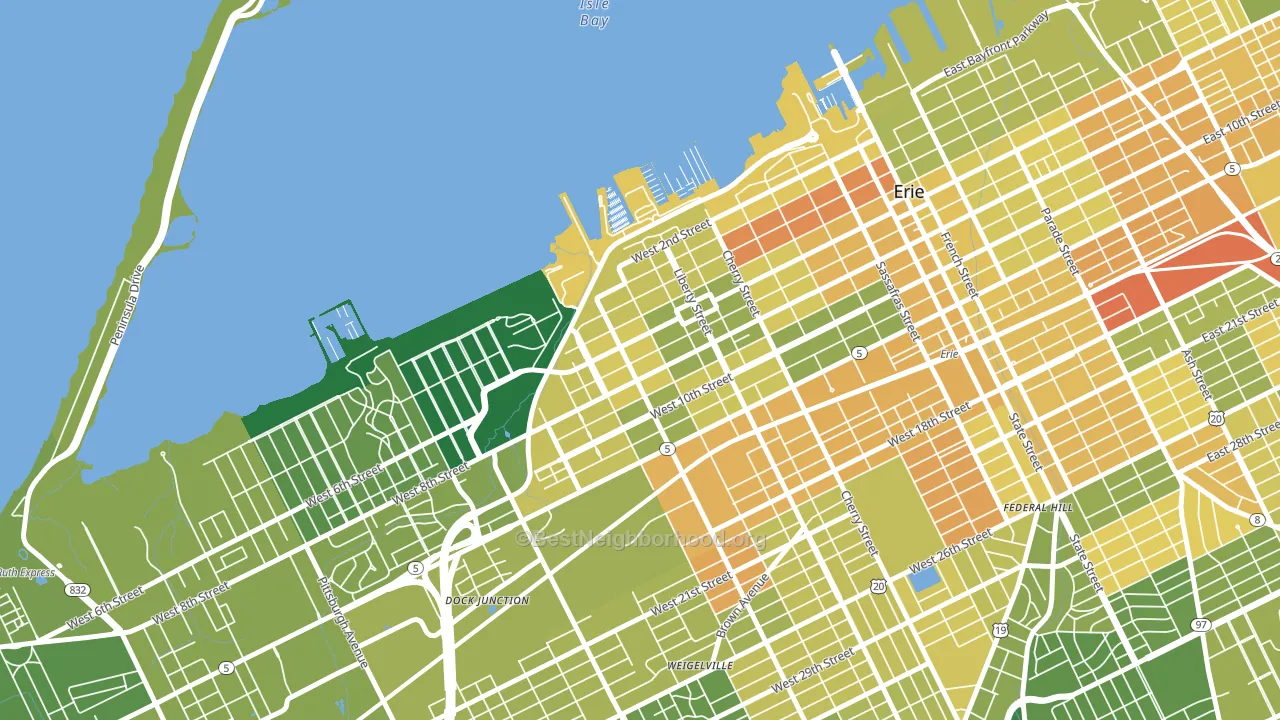
About 61% of adults in Bayfront typically vote, near the U.S. average of about 62%. Among adults in Bayfront, ~41% vote Democratic, ~20% Republican, and ~39% don't vote. The map below shows estimated turnout by block group.
How Bayfront compares
Among neighborhoods within 5 miles, Bayfront leans more Democratic than 7 of 10 neighbors.
Bayfront runs about 36 points more Democratic than Pennsylvania as a whole. Pennsylvania is roughly evenly split, and Bayfront sits clearly on the Democratic side.
Why Bayfront leans the way it does
This analysis examined 14,881 data points per neighborhood to find what predicts political lean and turnout. The items below are a few correlations that stood out for Bayfront, not a ranked or complete list of what matters most.
Bayfront votes against the grain of Pennsylvania. Pennsylvania is roughly evenly split, while Bayfront runs about 36 points more Democratic. A high never-married share predicts Democratic voting, and about 58% of adults in Bayfront have never been married, above 91% of neighborhoods.
Population density and Democratic lean
Places with high population density tend to lean Democratic; Bayfront, Erie, PA sits in the top quarter nationally on this measure.
Why turnout in Bayfront looks the way it does
High-crime urban areas turn out at lower rates, mostly because the housing stress common in those areas makes voting harder. Bayfront sits in the top 15% nationally on a violent-crime measure. See CrimeGrade for more details. Renters vote less often than owners, and about 63% of households in Bayfront rent, about 38 points above the U.S. average of 25%. Learn more about the findings and methodology on the political spectrum map.
Nearby Neighborhoods
Neighborhoods with Similar Populations
- Pyne Poynt, Camden, NJ D+61
- Queen Anne Park, Teaneck, NJ D+34
- Bear Creek, Irving, TX D+22
- Hope, Providence, RI D+78
- Monument Street, Baltimore, MD D+14
- Third World, San Antonio, TX D+29
- North University, Austin, TX D+72
- Gresham-Northeast, Gresham, OR D+10
- Plaza Midwood, Charlotte, NC D+40
- Forest Ridge-Quail Hollow, Dayton, OH R+5
Sources and methodology
Precinct-level voting records used to fit the model come from Pennsylvania Department of State, Bureau of Elections, distributed by the Voting and Election Science Team. Demographic inputs come from the U.S. Census Bureau (ACS 5-year estimates and the 2020 Decennial Census). Health and environmental inputs come from the CDC (PLACES and the Environmental Justice Index). Land cover comes from the USGS and EPA. Election-day and lead-up weather come from PRISM 4km daily grids and the NOAA Global Historical Climatology Network. Mail-voting and election-administration patterns come from the MIT Election Lab's Survey of the Performance of American Elections. Block-group crime detail comes from CrimeGrade. Internet data and modeling support provided by ISPreports.org.
Modeling and analysis by the BestNeighborhood data science team. Full methodology and findings: political spectrum map.
Methodology reviewed by the BestNeighborhood data team. Last updated May 2026.