Benton County leans heavily Democratic by roughly 42 points: about 71% of voters vote Democratic and 29% Republican.
About 74% of adults in Benton County typically vote, above the U.S. average of about 62%. Among adults in Benton County, ~52% vote Democratic, ~22% Republican, and ~26% don't vote. The map below shows estimated turnout by block group.

How Benton County compares
Among counties within 50 miles, Benton County is the most Democratic-leaning.
Benton County runs about 28 points more Democratic than Oregon as a whole.
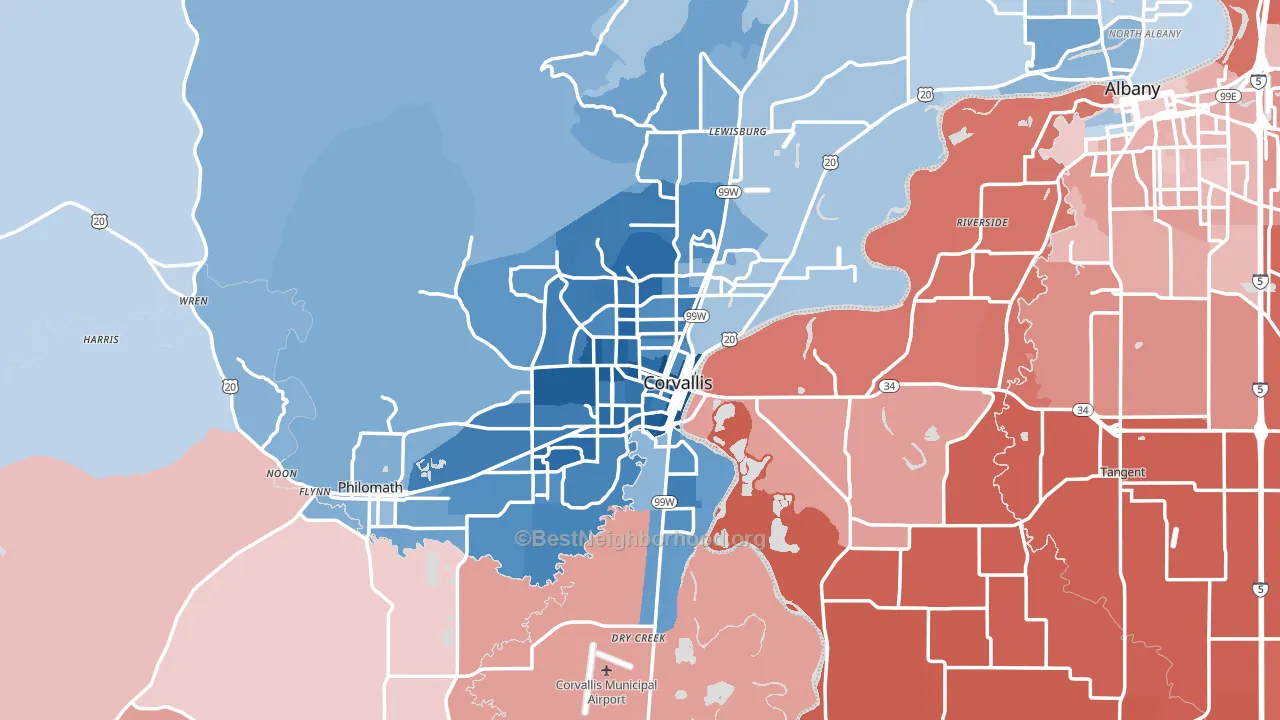
Politics vary noticeably by city within Benton County. The east side is the most Democratic-leaning (D+62) and the south side is the least Democratic-leaning (D+9), a spread of about 53 points.
Why Benton County leans the way it does
This analysis examined 14,881 data points per county to find what predicts political lean and turnout. The items below are a few correlations that stood out for Benton County, not a ranked or complete list of what matters most.
Areas with high college attainment vote Democratic. About 55% of adults in Benton County hold a bachelor's degree, about 26 points above the U.S. average of 28%. Dense areas vote Democratic, and Benton County sits in the top fifth on density (about 61%, above 86% of counties). A high never-married share predicts Democratic voting, and about 43% of adults in Benton County have never been married, above 96% of counties.
Population density and Democratic lean
Places with high population density tend to lean Democratic; Benton County, OR sits in the top tenth nationally on this measure.
Why turnout in Benton County looks the way it does
Areas with high high-school completion turn out at higher rates. About 96% of adults in Benton County have completed high school, about 6 points above the U.S. average of 90%. Learn more about the findings and methodology on the political spectrum map.
Nearby Counties
- Linn County, OR R+25
- Polk County, OR R+4
- Marion County, OR D+3
- Lincoln County, OR D+13
- Lane County, OR D+21
- Yamhill County, OR R+5
- Clackamas County, OR D+13
- Washington County, OR D+32
- Tillamook County, OR R+9
- Multnomah County, OR D+52
Counties with Similar Populations
- Grand Traverse County, MI R+3
- Rogers County, OK R+49
- Cape May County, NJ R+18
- Geauga County, OH R+30
- Nash County, NC D+3
- Fairbanks North Star Borough, AK R+9
- Lancaster County, SC R+23
- Cabell County, WV R+19
- Suffolk City, VA D+20
- Walton County, GA R+37
Sources and methodology
Precinct-level voting records used to fit the model come from Oregon Secretary of State, Elections Division, distributed by the Voting and Election Science Team. Demographic inputs come from the U.S. Census Bureau (ACS 5-year estimates and the 2020 Decennial Census). Health and environmental inputs come from the CDC (PLACES and the Environmental Justice Index). Land cover comes from the USGS and EPA. Election-day and lead-up weather come from PRISM 4km daily grids and the NOAA Global Historical Climatology Network. Mail-voting and election-administration patterns come from the MIT Election Lab's Survey of the Performance of American Elections. Block-group crime detail comes from CrimeGrade. Internet data and modeling support provided by ISPreports.org.
Modeling and analysis by the BestNeighborhood data science team. Full methodology and findings: political spectrum map.
Methodology reviewed by the BestNeighborhood data team. Last updated May 2026.