Berkeley is a Democratic stronghold. About 82% of voters here vote Democratic and 18% Republican.
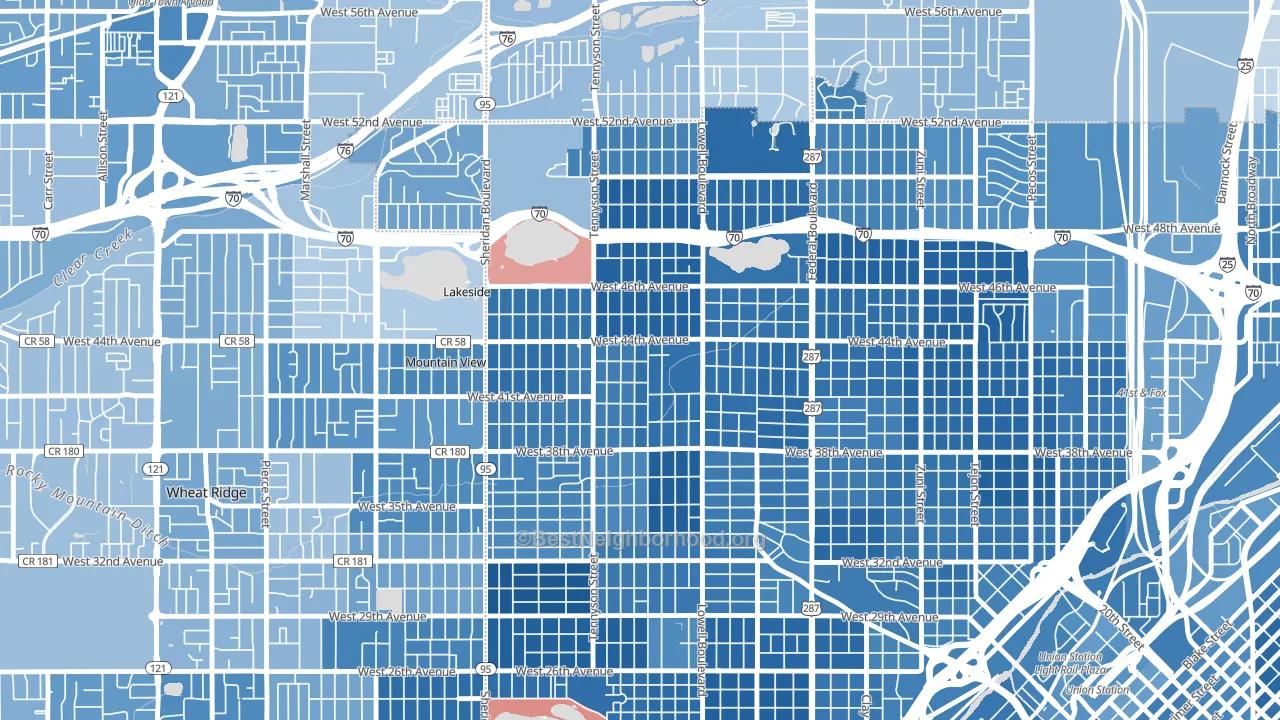
About 90% of adults in Berkeley typically vote, above the U.S. average of about 62%. Among adults in Berkeley, ~74% vote Democratic, ~16% Republican, and ~10% don't vote. The map below shows estimated turnout by block group.
How Berkeley compares
Among neighborhoods within 5 miles, Berkeley leans more Democratic than 32 of 42 neighbors.
Berkeley runs about 53 points more Democratic than Colorado as a whole.
Why Berkeley leans the way it does
This analysis examined 14,881 data points per neighborhood to find what predicts political lean and turnout. The items below are a few correlations that stood out for Berkeley, not a ranked or complete list of what matters most.
Areas with high college attainment vote Democratic. About 77% of adults in Berkeley hold a bachelor's degree, about 49 points above the U.S. average of 28%.
Population density and Democratic lean
Places with high population density tend to lean Democratic; Berkeley, Denver, CO sits in the top quarter nationally on this measure.
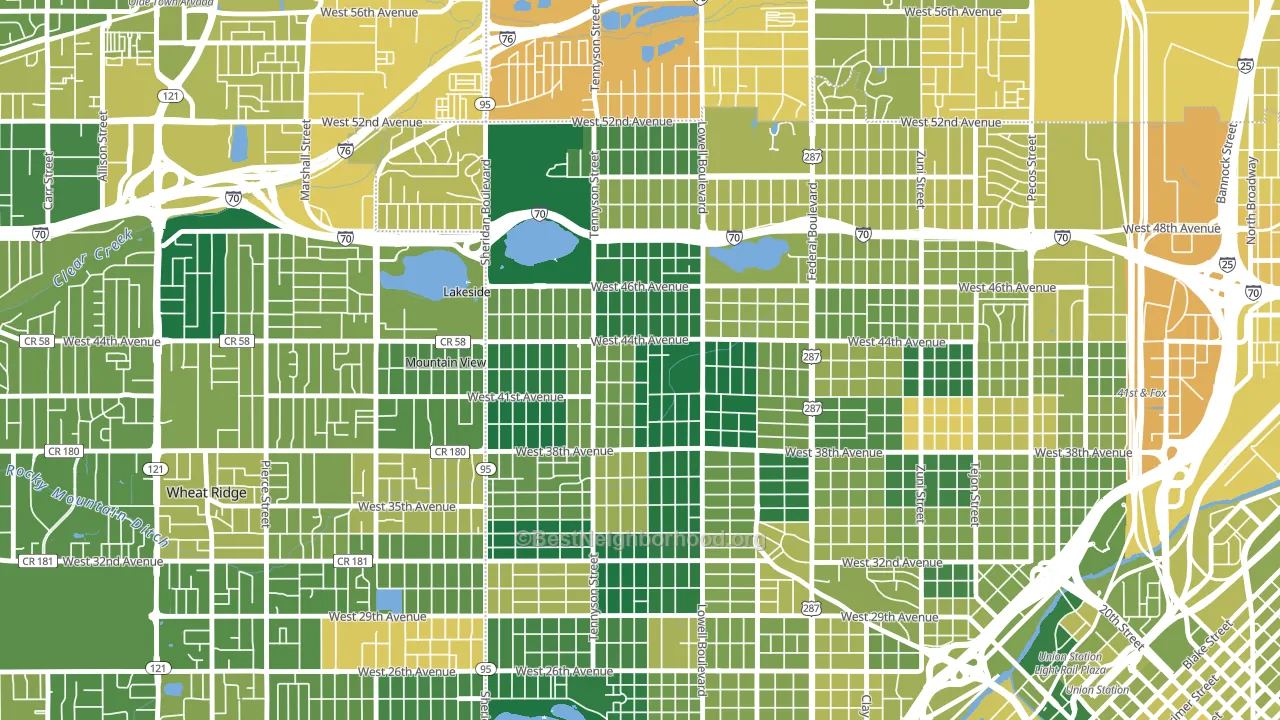
Why turnout in Berkeley looks the way it does
Areas with strong routine healthcare access turn out at higher rates. Berkeley is in the top quarter nationally for routine-care measures such as insurance coverage, preventive screenings, and dental visits. The dental-visit rate here is about 74%, about 14 points above the U.S. average of 60%. Learn more about the findings and methodology on the political spectrum map.
Nearby Neighborhoods
- West Highland, Denver, CO D+65
- Regis, Denver, CO D+54
- Northwestern Denver, Denver, CO D+48
- Sunnyside, Denver, CO D+66
- Sloan Lake, Denver, CO D+62
- Chaffee Park, Denver, CO D+50
- Highland, Denver, CO D+59
- Barths, Wheat Ridge, CO D+36
- Jefferson Park, Denver, CO D+57
- West Colfax, Denver, CO D+51
Neighborhoods with Similar Populations
- Southland Deerfield Open Gates, Lexington, KY D+30
- Rolling Hills Ranch, Chula Vista, CA D+9
- Midtown, Sacramento, CA D+71
- Westpointe, Salt Lake City, UT D+22
- Regent Park, Detroit, MI D+85
- Powderhorn Park, Minneapolis, MN D+73
- Woodland Acres, Jacksonville, FL D+26
- Mt Eden, Hayward, CA D+30
- Wolf Pen Creek District, College Station, TX D+30
- West Cambridge, Cambridge, MA D+78
Sources and methodology
Precinct-level voting records used to fit the model come from Colorado Secretary of State, Elections, distributed by the Voting and Election Science Team. Demographic inputs come from the U.S. Census Bureau (ACS 5-year estimates and the 2020 Decennial Census). Health and environmental inputs come from the CDC (PLACES and the Environmental Justice Index). Land cover comes from the USGS and EPA. Election-day and lead-up weather come from PRISM 4km daily grids and the NOAA Global Historical Climatology Network. Mail-voting and election-administration patterns come from the MIT Election Lab's Survey of the Performance of American Elections. Block-group crime detail comes from CrimeGrade. Internet data and modeling support provided by ISPreports.org.
Modeling and analysis by the BestNeighborhood data science team. Full methodology and findings: political spectrum map.
Methodology reviewed by the BestNeighborhood data team. Last updated May 2026.