Rolling Hills Ranch leans slightly Democratic by roughly 10 points: about 55% of voters vote Democratic and 45% Republican.
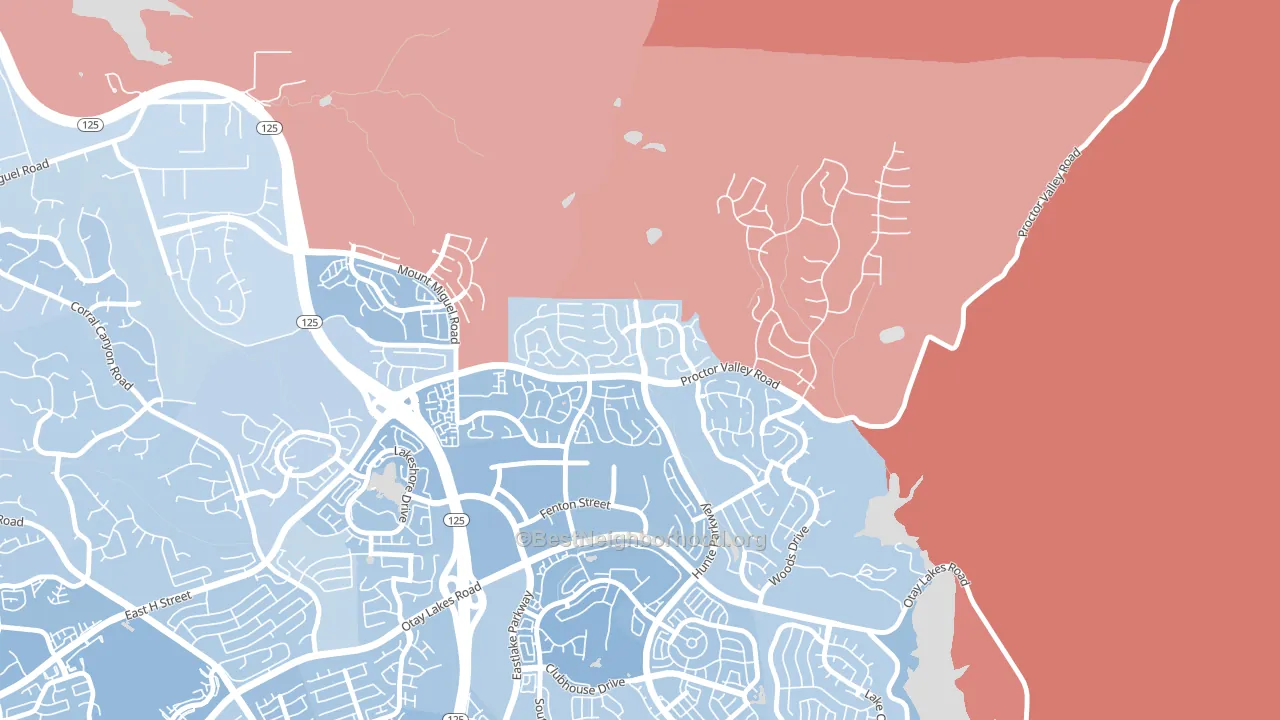
About 69% of adults in Rolling Hills Ranch typically vote, above the U.S. average of about 62%. Among adults in Rolling Hills Ranch, ~38% vote Democratic, ~31% Republican, and ~31% don't vote. The map below shows estimated turnout by block group.
How Rolling Hills Ranch compares
Among neighborhoods within 5 miles, Rolling Hills Ranch leans more Democratic than 1 of 9 neighbors.
Rolling Hills Ranch runs about 11 points more Republican than California as a whole.
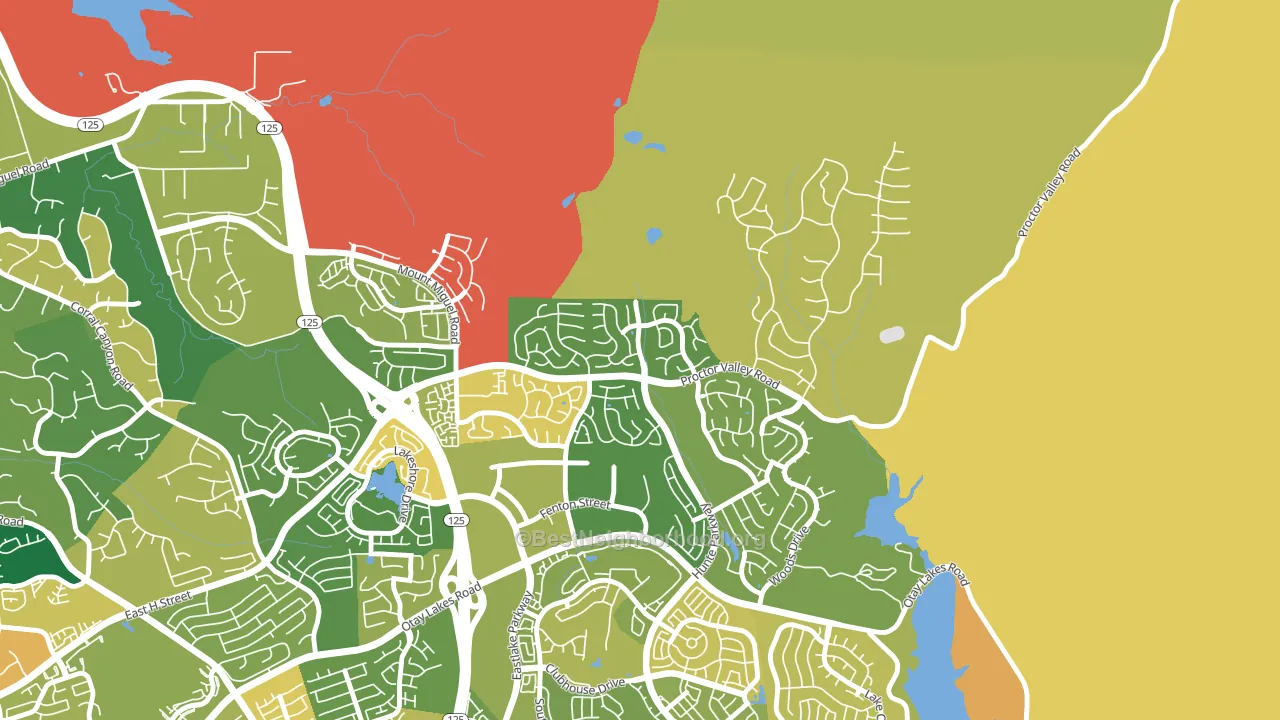
Politics vary noticeably by block within Rolling Hills Ranch. The southwest side runs the most Democratic (D+18) and the east side runs the most Republican (R+4), a spread of about 22 points.
Why Rolling Hills Ranch leans the way it does
Density, race composition, education, and family structure all sit close to their national averages in Rolling Hills Ranch. The lean here lands roughly where demographic data alone would predict.
Population density and Democratic lean
Places with high population density tend to lean Democratic; Rolling Hills Ranch, Chula Vista, CA sits above the national average on this measure.
Why turnout in Rolling Hills Ranch looks the way it does
Homeowners vote more often than renters. About 86% of households in Rolling Hills Ranch own their home, about 24 points above the California average of 62%. Learn more about the findings and methodology on the political spectrum map.
Nearby Neighborhoods
- San Miguel Ranch, Chula Vista, CA D+11
- East Lake, Chula Vista, CA D+16
- Eastlake Trails, Chula Vista, CA D+15
- Estlake Greens, Chula Vista, CA D+17
- Eastlake Vistas, Chula Vista, CA D+19
- Bonita Long Canyon, Bonita, CA D+7
- Otay Ranch, Chula Vista, CA D+16
- Rancho del Rey, Chula Vista, CA D+15
- Paseo Ranchoero, Chula Vista, CA D+16
- Lynwood Hills, Chula Vista, CA D+16
Neighborhoods with Similar Populations
- Westpointe, Salt Lake City, UT D+22
- Midtown, Sacramento, CA D+71
- Berkeley, Denver, CO D+64
- Southland Deerfield Open Gates, Lexington, KY D+30
- Regent Park, Detroit, MI D+85
- Woodland Acres, Jacksonville, FL D+26
- Powderhorn Park, Minneapolis, MN D+73
- West Cambridge, Cambridge, MA D+78
- Mt Eden, Hayward, CA D+30
- Klondike, Louisville, KY D+23
Sources and methodology
Precinct-level voting records used to fit the model come from California Secretary of State, Elections, distributed by the Voting and Election Science Team. Demographic inputs come from the U.S. Census Bureau (ACS 5-year estimates and the 2020 Decennial Census). Health and environmental inputs come from the CDC (PLACES and the Environmental Justice Index). Land cover comes from the USGS and EPA. Election-day and lead-up weather come from PRISM 4km daily grids and the NOAA Global Historical Climatology Network. Mail-voting and election-administration patterns come from the MIT Election Lab's Survey of the Performance of American Elections. Block-group crime detail comes from CrimeGrade. Internet data and modeling support provided by ISPreports.org.
Modeling and analysis by the BestNeighborhood data science team. Full methodology and findings: political spectrum map.
Methodology reviewed by the BestNeighborhood data team. Last updated May 2026.