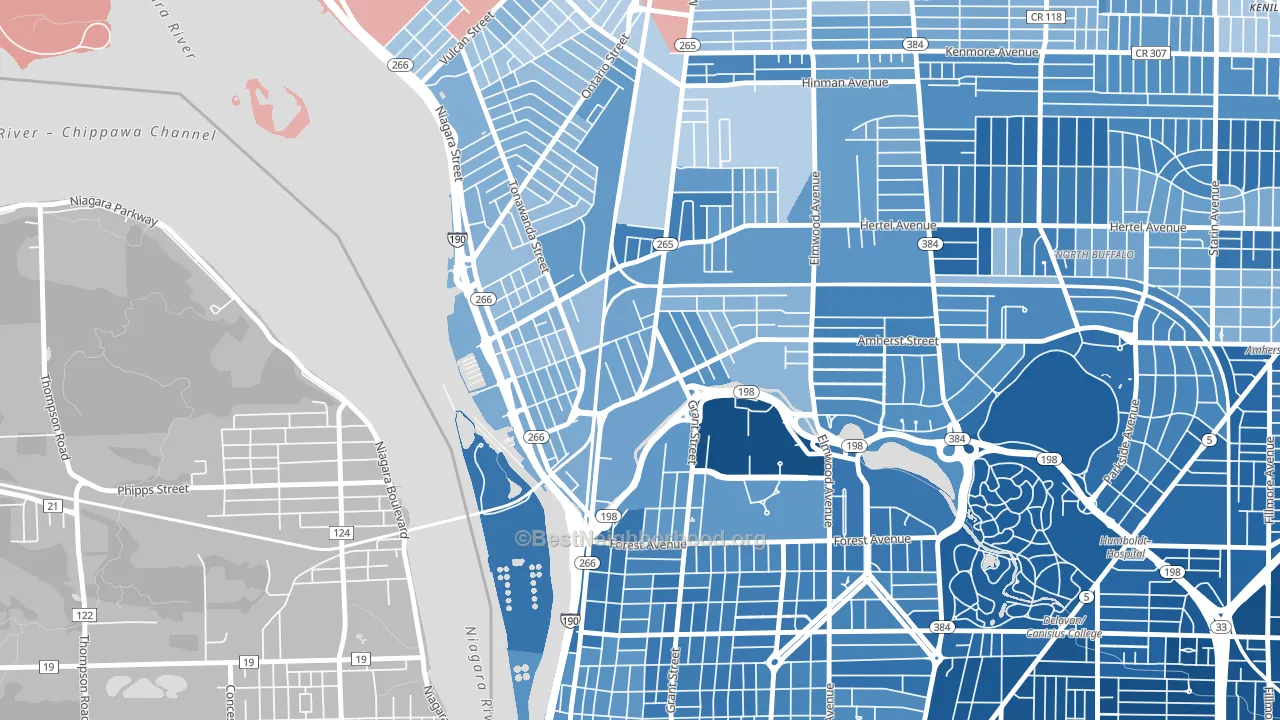
Black Rock leans Democratic by roughly 30 points: about 65% of voters vote Democratic and 35% Republican.
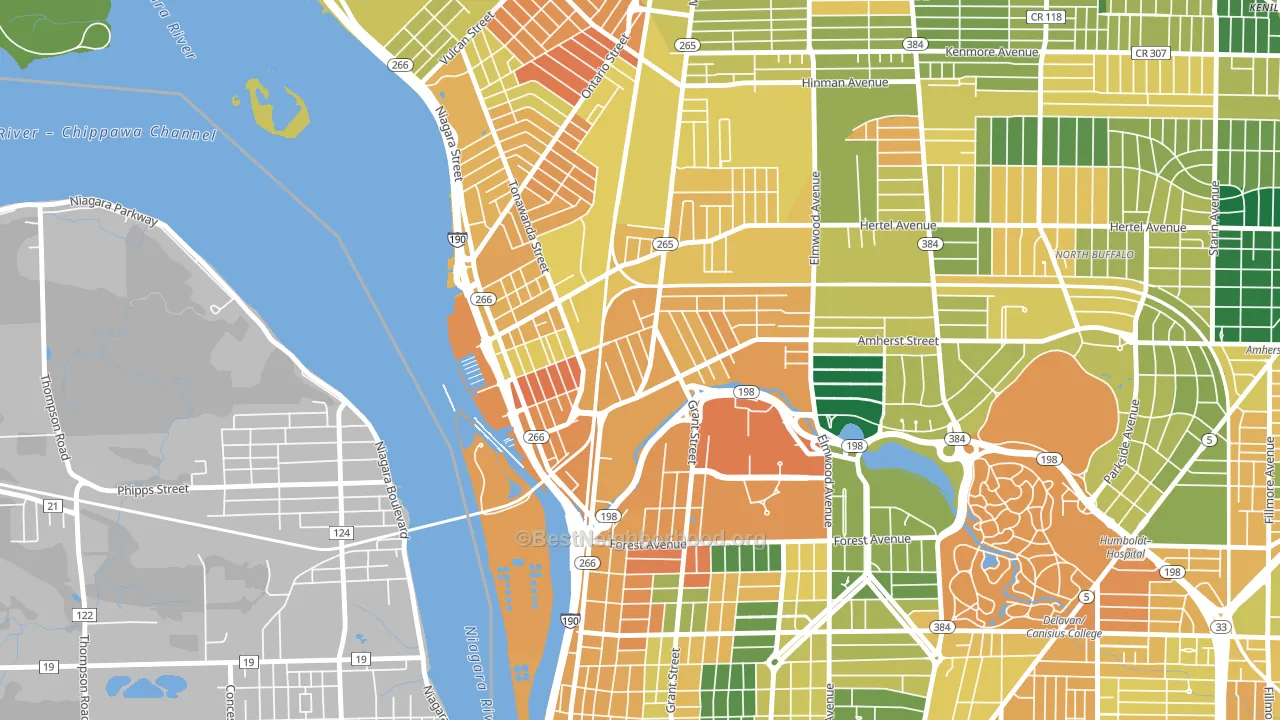
About 33% of adults in Black Rock typically vote, below the U.S. average of about 62%. Among adults in Black Rock, ~22% vote Democratic, ~12% Republican, and ~66% don't vote. The map below shows estimated turnout by block group.
How Black Rock compares
Among neighborhoods within 5 miles, Black Rock leans more Democratic than 2 of 29 neighbors.
Black Rock runs about 17 points more Democratic than New York as a whole.
Politics vary noticeably by block within Black Rock. The south side is the most Democratic-leaning (D+34) and the west side is the least Democratic-leaning (D+21), a spread of about 13 points.
Why Black Rock leans the way it does
This analysis examined 14,881 data points per neighborhood to find what predicts political lean and turnout. The items below are a few correlations that stood out for Black Rock, not a ranked or complete list of what matters most.
Areas with many never-married adults vote Democratic. About 57% of adults in Black Rock have never been married, modestly above similar-sized neighborhoods (around 44%).
Preventive-care access and voter turnout
Places with limited routine preventive-care access tend to turn out at a lower rate; Black Rock, Buffalo, NY sits in the bottom tenth nationally on this measure. Dental visits do not drive turnout; the rate reflects income, insurance, and healthcare access, which line up with who votes.
Why turnout in Black Rock looks the way it does
Renters vote less often than owners. About 76% of households in Black Rock rent, about 51 points above the U.S. average of 25%. High food insecurity lines up with lower turnout, and about 37% of adults in Black Rock report food insecurity, above 91% of neighborhoods. Low high-school completion lines up with lower turnout, and about 79% of adults in Black Rock have completed high school, below 86% of neighborhoods. Learn more about the findings and methodology on the political spectrum map.
Nearby Neighborhoods
- Military, Buffalo, NY D+33
- Forest, Buffalo, NY D+54
- Riverside Park, Buffalo, NY D+21
- Albright, Buffalo, NY D+59
- Park Meadow, Buffalo, NY D+57
- Grant Ferry, Buffalo, NY D+54
- Delaware-West Ferry, Buffalo, NY D+67
- North Park, Buffalo, NY D+48
- Front Park, Buffalo, NY D+47
- Bryant, Buffalo, NY D+68
Neighborhoods with Similar Populations
- Foothills, Henderson, NV R+17
- Central Park, Chicago, IL D+80
- The Lakes-Country Club, Spring Valley, NV D+11
- Homaker Park, Bakersfield, CA D+13
- South Central, Raleigh, NC D+69
- Turtle Creek, Jacksonville, FL D+75
- Woodlawn Lake, San Antonio, TX D+37
- Brentwood, Jacksonville, FL D+76
- Wood Streets, Riverside, CA D+17
- Franklin Heights, Milwaukee, WI D+88
Sources and methodology
Precinct-level voting records used to fit the model come from New York State Board of Elections, distributed by the Voting and Election Science Team. Demographic inputs come from the U.S. Census Bureau (ACS 5-year estimates and the 2020 Decennial Census). Health and environmental inputs come from the CDC (PLACES and the Environmental Justice Index). Land cover comes from the USGS and EPA. Election-day and lead-up weather come from PRISM 4km daily grids and the NOAA Global Historical Climatology Network. Mail-voting and election-administration patterns come from the MIT Election Lab's Survey of the Performance of American Elections. Block-group crime detail comes from CrimeGrade. Internet data and modeling support provided by ISPreports.org.
Modeling and analysis by the BestNeighborhood data science team. Full methodology and findings: political spectrum map.
Methodology reviewed by the BestNeighborhood data team. Last updated May 2026.