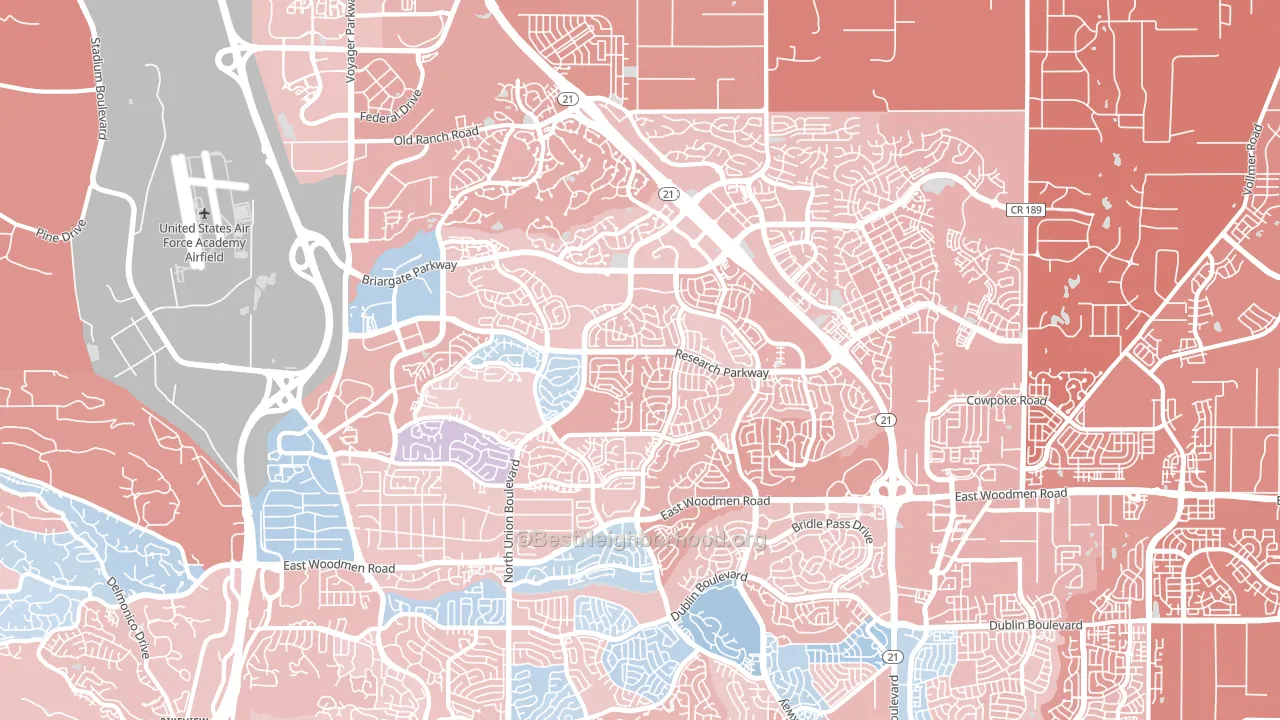
Briargate leans slightly Republican by roughly 10 points: about 45% of voters vote Democratic and 55% Republican.
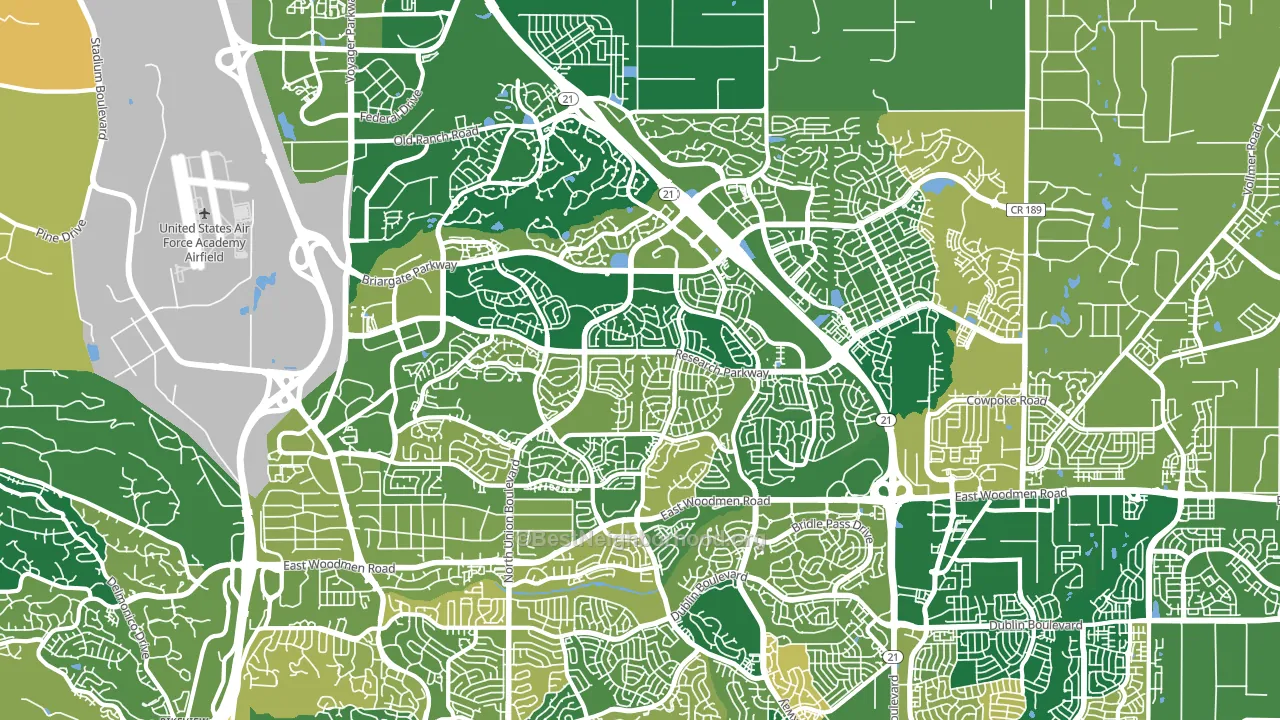
About 86% of adults in Briargate typically vote, above the U.S. average of about 62%. Among adults in Briargate, ~38% vote Democratic, ~47% Republican, and ~15% don't vote. The map below shows estimated turnout by block group.
How Briargate compares
Among neighborhoods within 5 miles, Briargate leans more Republican than 1 of 5 neighbors.
Briargate runs about 22 points more Republican than Colorado as a whole. Colorado leans Democratic overall, while Briargate is one of the few Republican-leaning pockets.
Why Briargate leans the way it does
This analysis examined 14,881 data points per neighborhood to find what predicts political lean and turnout. The items below are a few correlations that stood out for Briargate, not a ranked or complete list of what matters most.
Briargate votes against the grain of Colorado. Colorado leans Democratic overall, while Briargate runs about 22 points more Republican. A high family-household share predicts Republican voting, and about 74% of households in Briargate are family households, above 75% of neighborhoods.
High-school completion, uninsured rate, and voter turnout
Places that combine high-school-completion-heavy adults and a low uninsured rate tend to turn out at a higher rate, as Briargate, Colorado Springs, CO does.
Why turnout in Briargate looks the way it does
Areas with high high-school completion turn out at higher rates. About 98% of adults in Briargate have completed high school, about 5 points above the Colorado average of 93%. Learn more about the findings and methodology on the political spectrum map.
Nearby Neighborhoods
- Fairfax, Colorado Springs, CO R+16
- Stetson Hills, Colorado Springs, CO R+11
- Flying Horse, Colorado Springs, CO R+26
- Northeast Colorado Springs, Colorado Springs, CO Even
- Northgate, Colorado Springs, CO R+17
- Powers, Colorado Springs, CO R+4
- Black Forest, Colorado Springs, CO R+34
- Northwest Colorado Springs, Colorado Springs, CO Even
- East Colorado Springs, Colorado Springs, CO D+19
- West Colorado Springs, Colorado Springs, CO D+14
Neighborhoods with Similar Populations
- Lone Mountain, Las Vegas, NV D+6
- East Foothills, San Jose, CA D+27
- University Heights, Bronx, NY D+31
- Southeast Colorado Springs, Colorado Springs, CO D+12
- Valley Oak, Stockton, CA D+12
- Belmont Cragin, Chicago, IL D+33
- Humboldt Park, Chicago, IL D+61
- Far Northwest, Fort Worth, TX R+14
- Downtown San Francisco, San Francisco, CA D+56
- East Colorado Springs, Colorado Springs, CO D+19
Sources and methodology
Precinct-level voting records used to fit the model come from Colorado Secretary of State, Elections, distributed by the Voting and Election Science Team. Demographic inputs come from the U.S. Census Bureau (ACS 5-year estimates and the 2020 Decennial Census). Health and environmental inputs come from the CDC (PLACES and the Environmental Justice Index). Land cover comes from the USGS and EPA. Election-day and lead-up weather come from PRISM 4km daily grids and the NOAA Global Historical Climatology Network. Mail-voting and election-administration patterns come from the MIT Election Lab's Survey of the Performance of American Elections. Block-group crime detail comes from CrimeGrade. Internet data and modeling support provided by ISPreports.org.
Modeling and analysis by the BestNeighborhood data science team. Full methodology and findings: political spectrum map.
Methodology reviewed by the BestNeighborhood data team. Last updated May 2026.