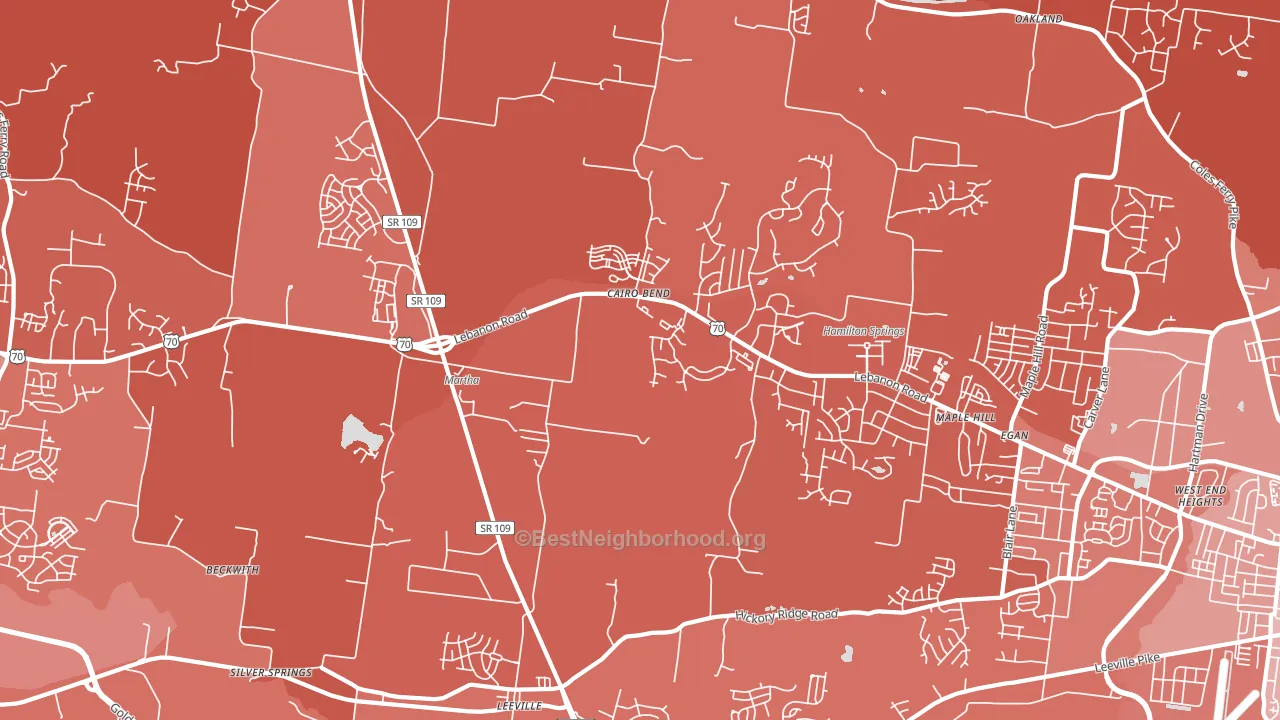
Cairo Bend leans heavily Republican by roughly 44 points: about 28% of voters vote Democratic and 72% Republican.
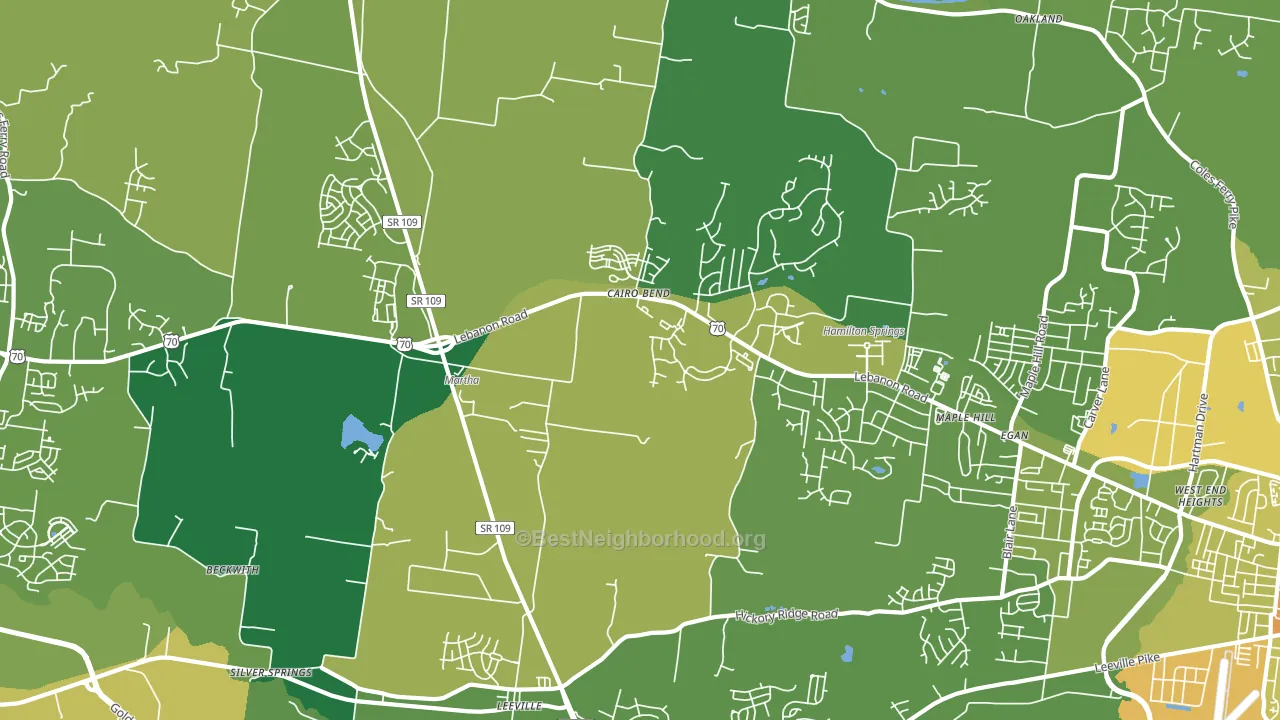
About 84% of adults in Cairo Bend typically vote, above the U.S. average of about 62%. Among adults in Cairo Bend, ~24% vote Democratic, ~60% Republican, and ~16% don't vote. The map below shows estimated turnout by block group.
How Cairo Bend compares
Among cities within 25 miles, Cairo Bend leans more Republican than 18 of 60 neighbors.
Cairo Bend runs about 13 points more Republican than Tennessee as a whole.
Politics vary noticeably by neighborhood within Cairo Bend. The north side is the most Republican-leaning (R+51) and the northwest side is the least Republican-leaning (R+39), a spread of about 12 points.
Why Cairo Bend leans the way it does
This analysis examined 14,881 data points per city to find what predicts political lean and turnout. The items below are a few correlations that stood out for Cairo Bend, not a ranked or complete list of what matters most.
Cairo Bend votes Republican even though it is densely developed (about 32%, modestly above the Tennessee average of 21%). State and regional patterns outweigh the Democratic lean that density usually predicts here. A high family-household share predicts Republican voting, and about 79% of households in Cairo Bend are family households, above 87% of cities.
Homeownership and voter turnout
Places with homeowner-heavy households tend to turn out at a higher rate; Cairo Bend, TN sits in the top quarter nationally on this measure.
Why turnout in Cairo Bend looks the way it does
Areas with high high-school completion turn out at higher rates. About 97% of adults in Cairo Bend have completed high school, about 9 points above the Tennessee average of 88%. Homeowners vote more often than renters, and about 91% of households in Cairo Bend own their home, about 16 points above the U.S. average of 75%. Learn more about the findings and methodology on the political spectrum map.
Nearby Cities
- Lebanon, TN R+40
- Laguardo, TN R+51
- Mount Juliet, TN R+34
- Gladeville, TN R+53
- Green Hill, TN R+39
- Suggs Creek, TN R+46
- Taylorsville, TN R+60
- Gallatin, TN R+27
- Hermitage, TN D+10
- Old Hickory, TN R+18
Cities with Similar Populations
- North Oxford, MA R+12
- Pine Ridge, SC R+34
- Seabrook Island, SC R+8
- Naalehu, HI D+10
- Wathena, KS R+60
- Rock Creek, OH R+50
- Mineola, IA R+37
- Union Grove, NC R+66
- Fancy Farm, KY R+67
- Toledo, IL R+61
Sources and methodology
Precinct-level voting records used to fit the model come from Tennessee Secretary of State, Division of Elections, distributed by the Voting and Election Science Team. Demographic inputs come from the U.S. Census Bureau (ACS 5-year estimates and the 2020 Decennial Census). Health and environmental inputs come from the CDC (PLACES and the Environmental Justice Index). Land cover comes from the USGS and EPA. Election-day and lead-up weather come from PRISM 4km daily grids and the NOAA Global Historical Climatology Network. Mail-voting and election-administration patterns come from the MIT Election Lab's Survey of the Performance of American Elections. Block-group crime detail comes from CrimeGrade. Internet data and modeling support provided by ISPreports.org.
Modeling and analysis by the BestNeighborhood data science team. Full methodology and findings: political spectrum map.
Methodology reviewed by the BestNeighborhood data team. Last updated May 2026.