Caldwell Parish is a Republican stronghold. About 14% of voters here vote Democratic and 86% Republican.
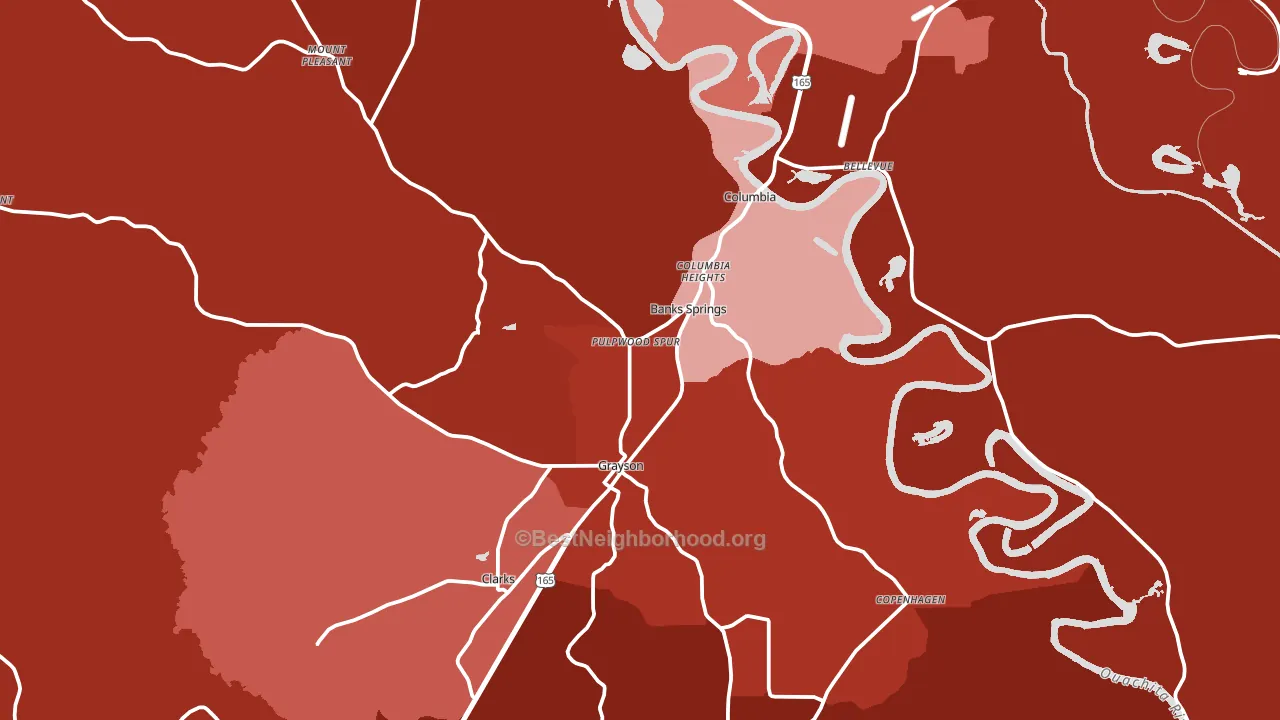
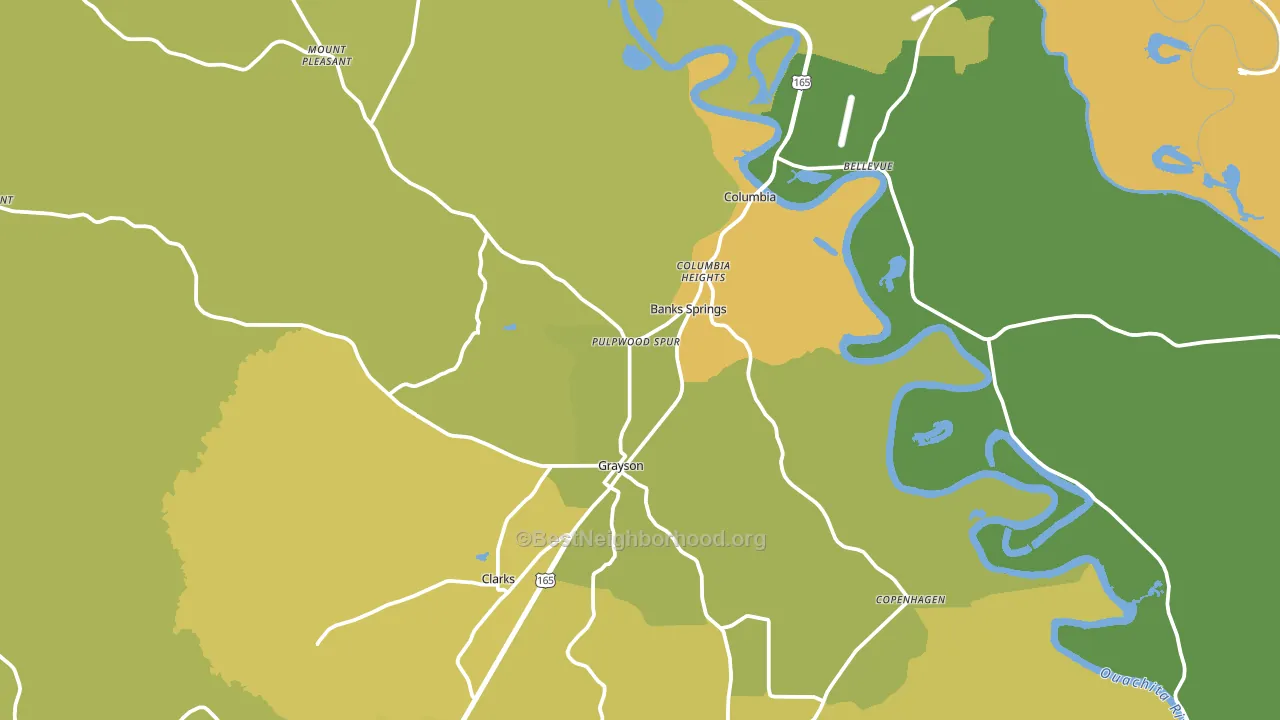
About 60% of adults in Caldwell Parish typically vote, near the U.S. average of about 62%. Among adults in Caldwell Parish, ~8% vote Democratic, ~52% Republican, and ~40% don't vote. The map below shows estimated turnout by block group.
How Caldwell Parish compares
Among counties within 50 miles, Caldwell Parish leans more Republican than 10 of 11 neighbors.
Caldwell Parish runs about 51 points more Republican than Louisiana as a whole.
Politics vary noticeably by city within Caldwell Parish. The southwest side is the most Republican-leaning (R+88) and the north side is the least Republican-leaning (R+41), a spread of about 47 points.
Why Caldwell Parish leans the way it does
This analysis examined 14,881 data points per county to find what predicts political lean and turnout. The items below are a few correlations that stood out for Caldwell Parish, not a ranked or complete list of what matters most.
Rural areas vote Republican. About 8% of residents in Caldwell Parish live in densely developed areas, about 17 points below the Louisiana average of 25%. Low college attainment predicts Republican voting, and Caldwell Parish sits in the bottom quarter (about 12%, below 97% of counties).
Population density and Republican lean
Places with low population density tend to lean Republican; Caldwell Parish, LA sits in the bottom quarter nationally on this measure.
Why turnout in Caldwell Parish looks the way it does
Areas with high food insecurity turn out at lower rates. About 26% of adults in Caldwell Parish report food insecurity, about 10 points above the U.S. average of 16%. Low high-school completion lines up with lower turnout, and about 83% of adults in Caldwell Parish have completed high school, below 89% of counties. Learn more about the findings and methodology on the political spectrum map.
Nearby Counties
- LaSalle Parish, LA R+71
- Franklin Parish, LA R+38
- Ouachita Parish, LA R+13
- Catahoula Parish, LA R+50
- Richland Parish, LA R+38
- Jackson Parish, LA R+43
- Winn Parish, LA R+44
- Grant Parish, LA R+77
- Lincoln Parish, LA R+13
- Concordia Parish, LA R+24
Counties with Similar Populations
- Irwin County, GA R+43
- Grand County, UT R+2
- Zavala County, TX D+4
- Stevens County, MN R+37
- Cumberland County, VA R+23
- Humboldt County, IA R+43
- Wayne County, NE R+44
- Linn County, KS R+61
- Rock County, MN R+45
- Chattahoochee County, GA R+14
Sources and methodology
Precinct-level voting records used to fit the model come from Louisiana Secretary of State, Elections, distributed by the Voting and Election Science Team. Demographic inputs come from the U.S. Census Bureau (ACS 5-year estimates and the 2020 Decennial Census). Health and environmental inputs come from the CDC (PLACES and the Environmental Justice Index). Land cover comes from the USGS and EPA. Election-day and lead-up weather come from PRISM 4km daily grids and the NOAA Global Historical Climatology Network. Mail-voting and election-administration patterns come from the MIT Election Lab's Survey of the Performance of American Elections. Block-group crime detail comes from CrimeGrade. Internet data and modeling support provided by ISPreports.org.
Modeling and analysis by the BestNeighborhood data science team. Full methodology and findings: political spectrum map.
Methodology reviewed by the BestNeighborhood data team. Last updated May 2026.