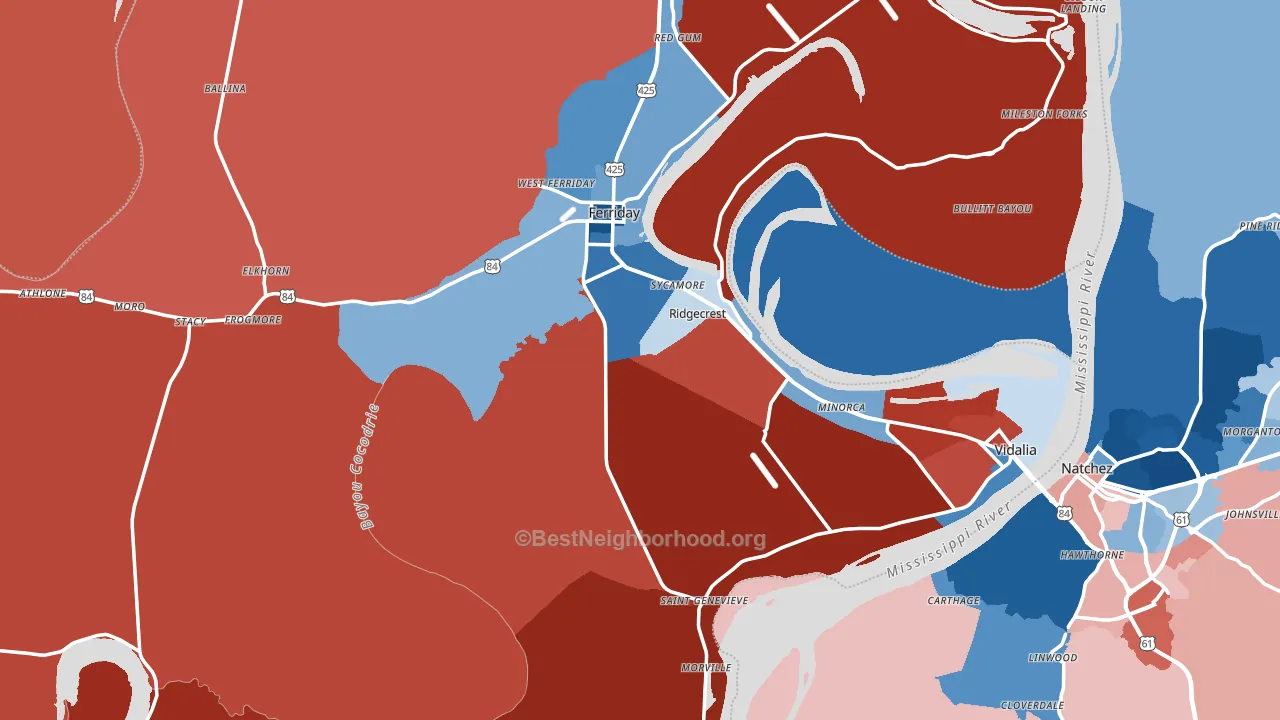
Concordia Parish leans Republican by roughly 24 points: about 38% of voters vote Democratic and 62% Republican.
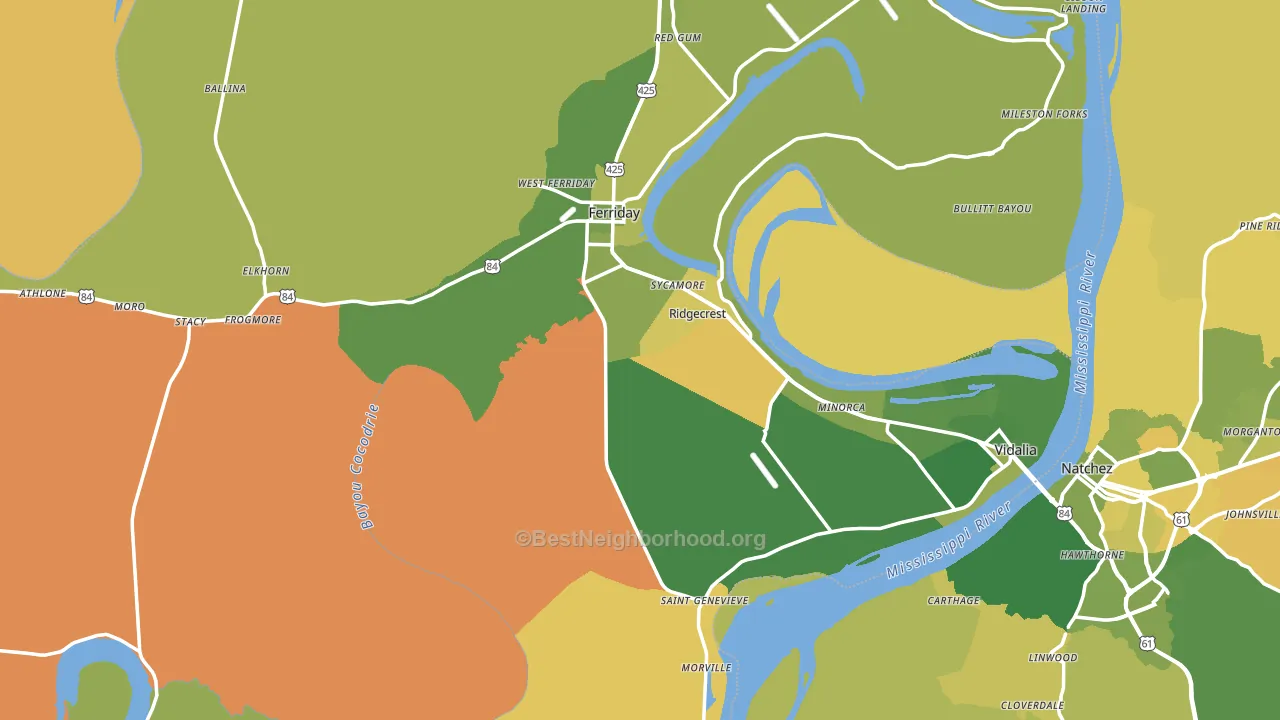
About 72% of adults in Concordia Parish typically vote, above the U.S. average of about 62%. Among adults in Concordia Parish, ~27% vote Democratic, ~45% Republican, and ~28% don't vote. The map below shows estimated turnout by block group.
How Concordia Parish compares
Among counties within 50 miles, Concordia Parish leans more Republican than 5 of 12 neighbors.
Politically, Concordia Parish sits close to the rest of Louisiana.
Politics vary noticeably by city within Concordia Parish. The north side runs the most Democratic (D+38) and the south side runs the most Republican (R+90), a spread of about 128 points.
Why Concordia Parish leans the way it does
This analysis examined 14,881 data points per county to find what predicts political lean and turnout. The items below are a few correlations that stood out for Concordia Parish, not a ranked or complete list of what matters most.
Car-dependent areas vote Republican. About 87% of residents in Concordia Parish drive to work alone, about 13 points above the U.S. average of 74%.
Food insecurity and voter turnout
Places with high food insecurity tend to turn out at a lower rate; Concordia Parish, LA sits in the top tenth nationally on this measure. Food insecurity does not directly drive turnout; it reflects economic hardship, which lines up with lower voting.
Why turnout in Concordia Parish looks the way it does
Turnout in Concordia Parish sits close to the national pattern. Routine healthcare access, homeownership, education, and food security all land near their national averages here. Learn more about the findings and methodology on the political spectrum map.
Nearby Counties
- Adams County, MS D+17
- Catahoula Parish, LA R+50
- Tensas Parish, LA R+4
- Jefferson County, MS D+63
- Wilkinson County, MS D+38
- LaSalle Parish, LA R+71
- Franklin Parish, LA R+38
- Franklin County, MS R+35
- Claiborne County, MS D+61
- Caldwell Parish, LA R+73
Counties with Similar Populations
- Otero County, CO R+23
- Harrison County, KY R+51
- Crawford County, IL R+50
- Bethel Census Area, AK D+18
- Poweshiek County, IA R+19
- Warren County, NC D+19
- Clay County, MS D+18
- Andrews County, TX R+62
- Deaf Smith County, TX R+30
- Randolph County, AR R+63
Sources and methodology
Precinct-level voting records used to fit the model come from Louisiana Secretary of State, Elections, distributed by the Voting and Election Science Team. Demographic inputs come from the U.S. Census Bureau (ACS 5-year estimates and the 2020 Decennial Census). Health and environmental inputs come from the CDC (PLACES and the Environmental Justice Index). Land cover comes from the USGS and EPA. Election-day and lead-up weather come from PRISM 4km daily grids and the NOAA Global Historical Climatology Network. Mail-voting and election-administration patterns come from the MIT Election Lab's Survey of the Performance of American Elections. Block-group crime detail comes from CrimeGrade. Internet data and modeling support provided by ISPreports.org.
Modeling and analysis by the BestNeighborhood data science team. Full methodology and findings: political spectrum map.
Methodology reviewed by the BestNeighborhood data team. Last updated May 2026.