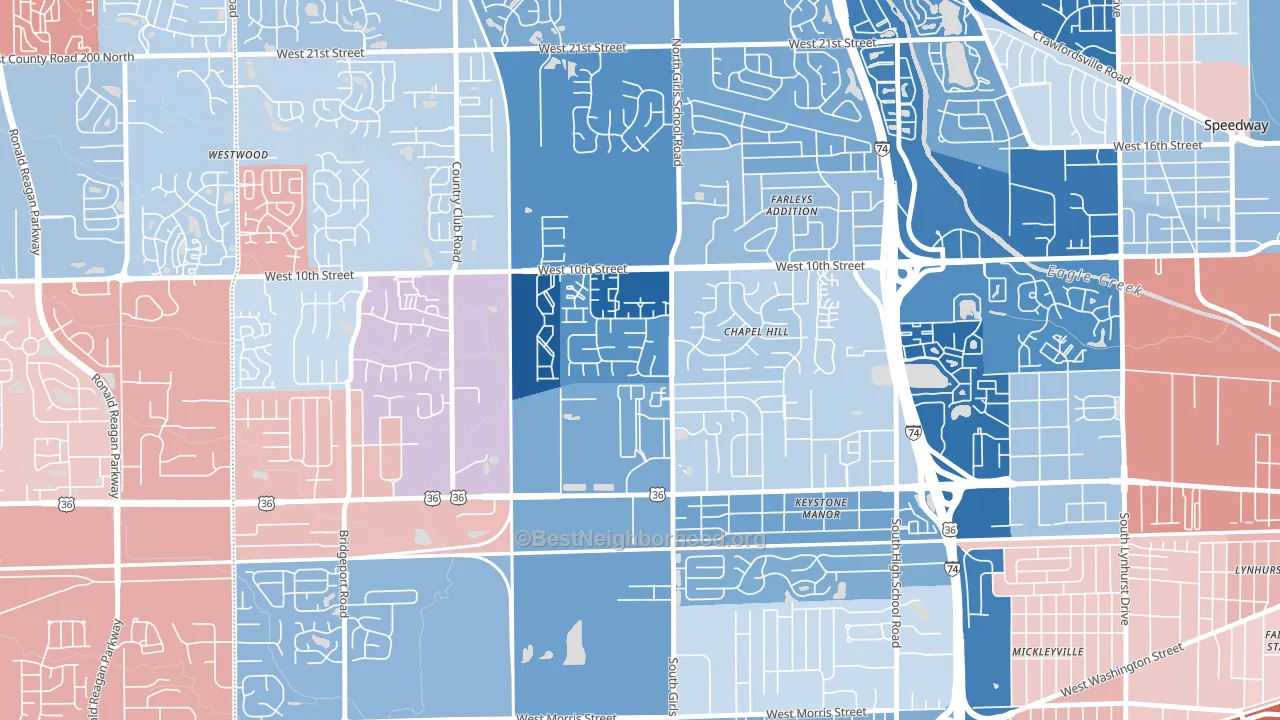
Chapel Hill Village leans heavily Democratic by roughly 32 points: about 66% of voters vote Democratic and 34% Republican.
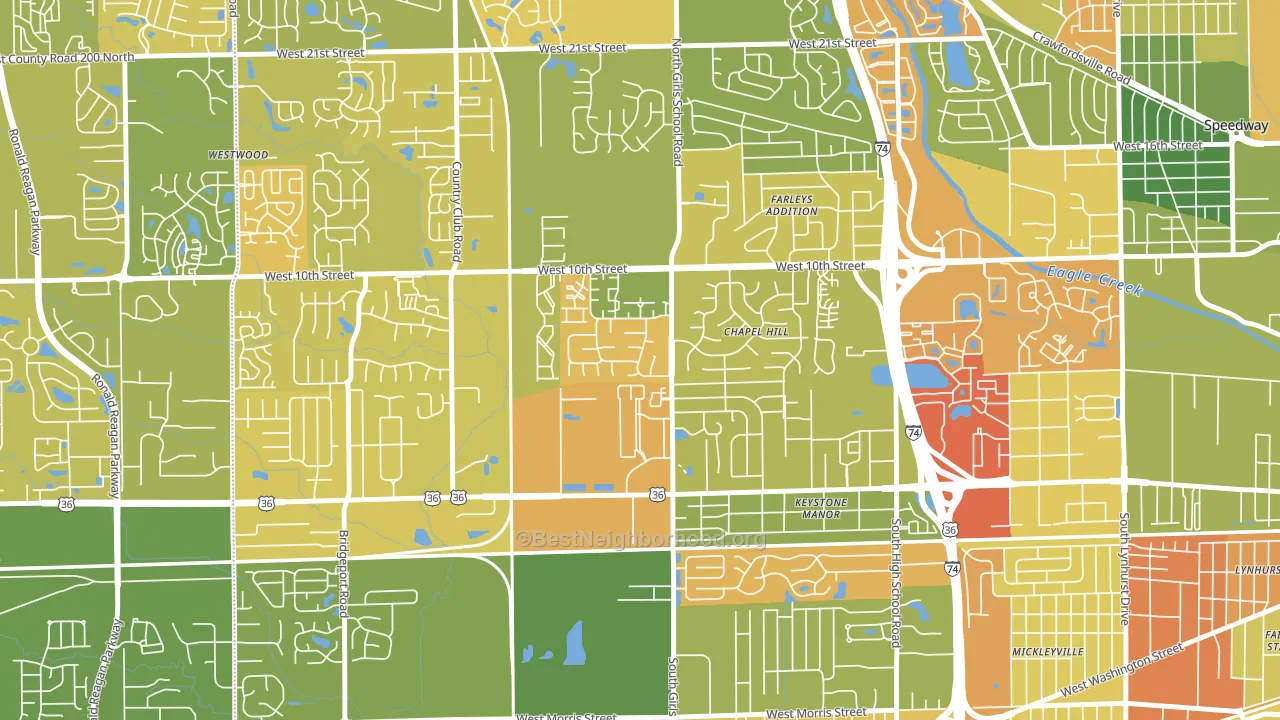
About 54% of adults in Chapel Hill Village typically vote, below the U.S. average of about 62%. Among adults in Chapel Hill Village, ~36% vote Democratic, ~18% Republican, and ~46% don't vote. The map below shows estimated turnout by block group.
How Chapel Hill Village compares
Among neighborhoods within 5 miles, Chapel Hill Village is the least Democratic-leaning.
Chapel Hill Village runs about 52 points more Democratic than Indiana as a whole. Indiana leans Republican overall, while Chapel Hill Village is one of the few Democratic-leaning pockets.
Politics vary noticeably by block within Chapel Hill Village. The northwest side is the most Democratic-leaning (D+57) and the southeast side is the least Democratic-leaning (Even), a spread of about 56 points.
Why Chapel Hill Village leans the way it does
This analysis examined 14,881 data points per neighborhood to find what predicts political lean and turnout. The items below are a few correlations that stood out for Chapel Hill Village, not a ranked or complete list of what matters most.
Chapel Hill Village votes against the grain of Indiana. Indiana leans Republican overall, while Chapel Hill Village runs about 52 points more Democratic.
Paved land cover and Democratic lean
Places with extensive paved surfaces tend to lean Democratic; Chapel Hill Village, Indianapolis, IN sits above the national average on this measure. Paved ground does not change how people vote; it mostly reflects how urban and built-up a place is.
Why turnout in Chapel Hill Village looks the way it does
Areas with low high-school completion turn out at lower rates. About 84% of adults in Chapel Hill Village have completed high school, about 6 points below the U.S. average of 90%. Learn more about the findings and methodology on the political spectrum map.
Nearby Neighborhoods
- Aspen Ridge, Indianapolis, IN D+56
- Eagledale, Indianapolis, IN D+35
- Bayswater, Indianapolis, IN D+59
- Venerable Flackville, Indianapolis, IN D+70
- Downtown Indianapolis, Indianapolis, IN D+54
- St. Joseph Historic Neighborhood, Indianapolis, IN D+62
- Highland Vicinity, Indianapolis, IN D+77
- Chatham-Arch, Indianapolis, IN D+57
- Mapleton-Fall Creek, Indianapolis, IN D+73
- Meridian-Kessler, Indianapolis, IN D+57
Neighborhoods with Similar Populations
- Hall Manor, Harrisburg, PA D+59
- Keeling, Tucson, AZ D+38
- Nashua Historic District, Nashua, NH D+24
- Iroquois, Louisville, KY D+23
- Eastmoreland, Portland, OR D+77
- Bensville, Waldorf, MD D+53
- Stanford, Roseville, CA R+5
- Camden, Salisbury, MD D+26
- Far Southside, Abilene, TX R+53
- Fort des Moines, Des Moines, IA D+17
Sources and methodology
Precinct-level voting records used to fit the model come from Indiana Secretary of State, Elections, distributed by the Voting and Election Science Team. Demographic inputs come from the U.S. Census Bureau (ACS 5-year estimates and the 2020 Decennial Census). Health and environmental inputs come from the CDC (PLACES and the Environmental Justice Index). Land cover comes from the USGS and EPA. Election-day and lead-up weather come from PRISM 4km daily grids and the NOAA Global Historical Climatology Network. Mail-voting and election-administration patterns come from the MIT Election Lab's Survey of the Performance of American Elections. Block-group crime detail comes from CrimeGrade. Internet data and modeling support provided by ISPreports.org.
Modeling and analysis by the BestNeighborhood data science team. Full methodology and findings: political spectrum map.
Methodology reviewed by the BestNeighborhood data team. Last updated May 2026.