Bayswater is a Democratic stronghold. About 80% of voters here vote Democratic and 20% Republican.
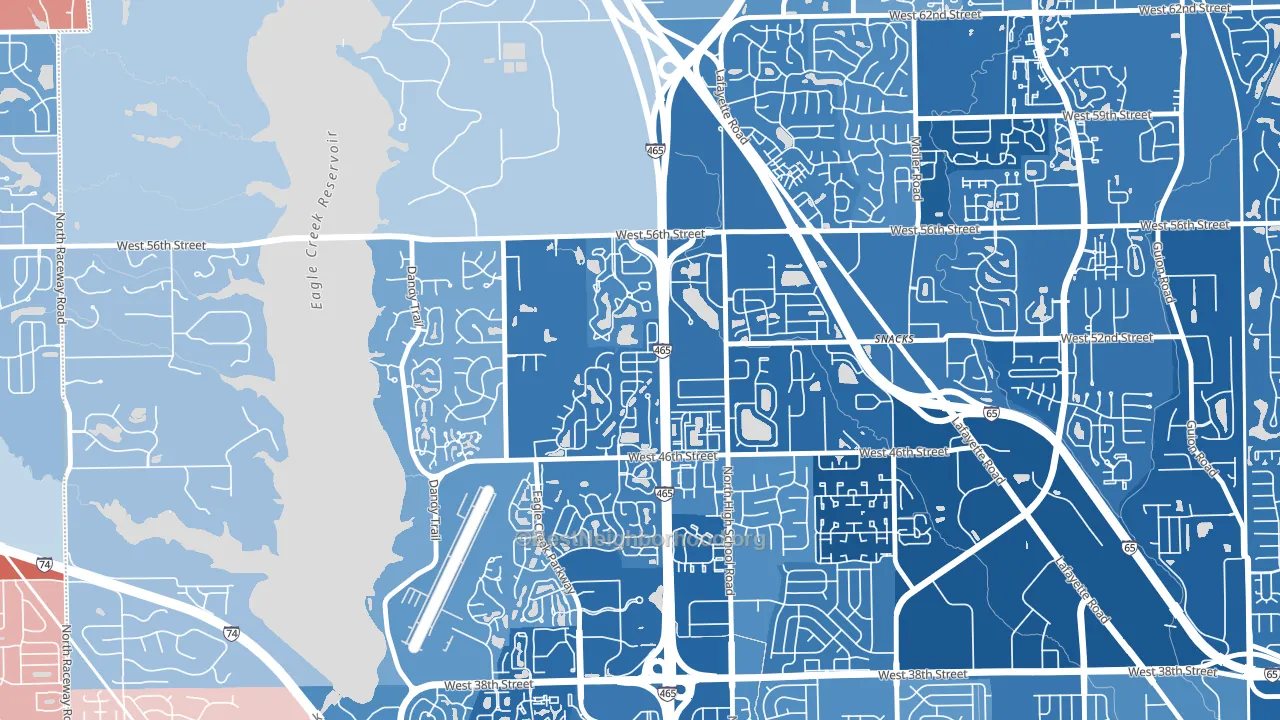
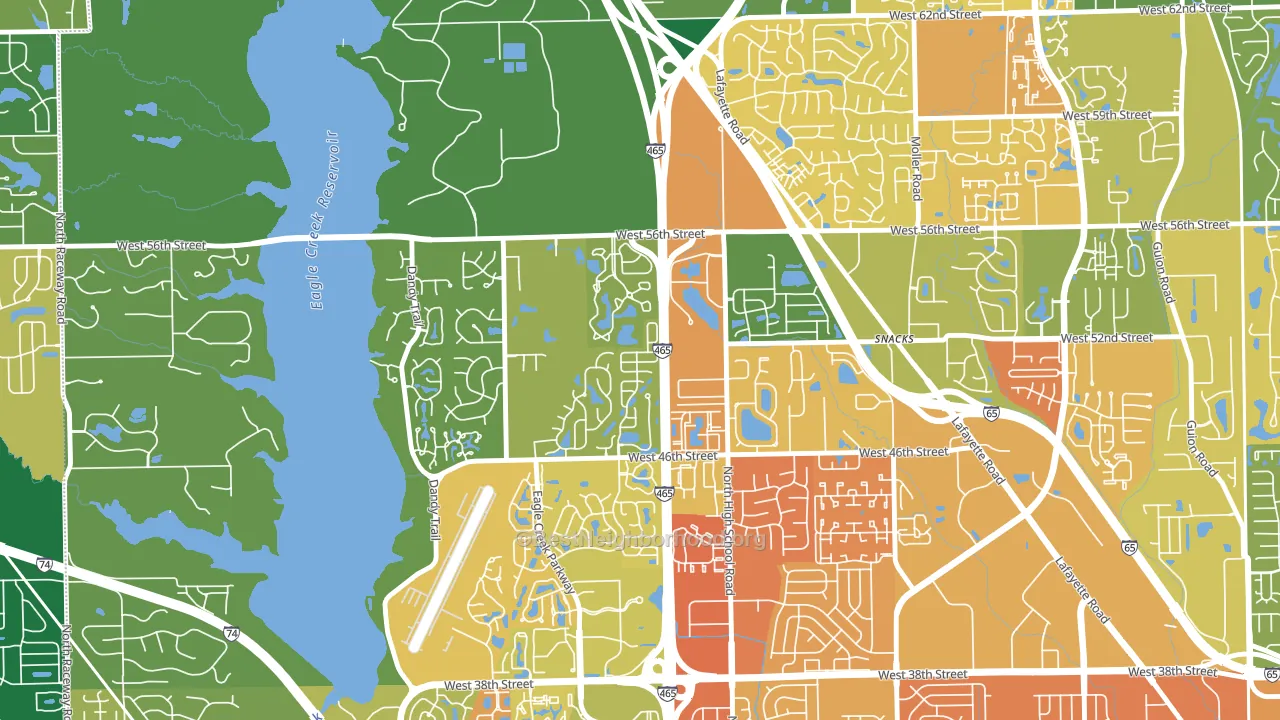
About 58% of adults in Bayswater typically vote, near the U.S. average of about 62%. Among adults in Bayswater, ~46% vote Democratic, ~12% Republican, and ~42% don't vote. The map below shows estimated turnout by block group.
How Bayswater compares
Among neighborhoods within 5 miles, Bayswater leans more Democratic than 3 of 4 neighbors.
Bayswater runs about 78 points more Democratic than Indiana as a whole. Indiana leans Republican overall, while Bayswater is one of the few Democratic-leaning pockets.
Why Bayswater leans the way it does
This analysis examined 14,881 data points per neighborhood to find what predicts political lean and turnout. The items below are a few correlations that stood out for Bayswater, not a ranked or complete list of what matters most.
Bayswater votes against the grain of Indiana. Indiana leans Republican overall, while Bayswater runs about 78 points more Democratic. A high never-married share predicts Democratic voting, and about 52% of adults in Bayswater have never been married, above 85% of neighborhoods.
Park access and Democratic lean
Places with heavy park coverage tend to lean Democratic; Bayswater, Indianapolis, IN sits in the top quarter nationally on this measure. Park access does not change how people vote; it tends to track denser, higher-income areas.
Why turnout in Bayswater looks the way it does
Crowded housing lines up with lower turnout. About 10% of homes in Bayswater have more than one occupant per room, above 92% of neighborhoods. Renters vote less often than owners, and about 65% of households in Bayswater rent, about 40 points above the U.S. average of 25%. Learn more about the findings and methodology on the political spectrum map.
Nearby Neighborhoods
- Aspen Ridge, Indianapolis, IN D+56
- Eagledale, Indianapolis, IN D+35
- Venerable Flackville, Indianapolis, IN D+70
- Chapel Hill Village, Indianapolis, IN D+33
- Westchester Estates, Indianapolis, IN D+55
- Highland Vicinity, Indianapolis, IN D+77
- North Willow Farms, Indianapolis, IN D+49
- Meridian-Kessler, Indianapolis, IN D+57
- Mapleton-Fall Creek, Indianapolis, IN D+73
- Broad Ripple, Indianapolis, IN D+48
Neighborhoods with Similar Populations
- Jennings Lodge, Portland, OR D+22
- Old Colorado City, Colorado Springs, CO D+4
- Pennington-Prospect, Trenton, NJ D+85
- Westmont, Tillmans Corner, AL R+31
- Moose Can Gully, Missoula, MT D+23
- Tahoe Park, Sacramento, CA D+54
- Bay Colony, Baldwin Harbor, NY D+43
- North Riverdale, Dayton, OH D+61
- Euclid Ave North, Helena, MT D+13
- Friendly Hills, Dakota Ridge, CO D+8
Sources and methodology
Precinct-level voting records used to fit the model come from Indiana Secretary of State, Elections, distributed by the Voting and Election Science Team. Demographic inputs come from the U.S. Census Bureau (ACS 5-year estimates and the 2020 Decennial Census). Health and environmental inputs come from the CDC (PLACES and the Environmental Justice Index). Land cover comes from the USGS and EPA. Election-day and lead-up weather come from PRISM 4km daily grids and the NOAA Global Historical Climatology Network. Mail-voting and election-administration patterns come from the MIT Election Lab's Survey of the Performance of American Elections. Block-group crime detail comes from CrimeGrade. Internet data and modeling support provided by ISPreports.org.
Modeling and analysis by the BestNeighborhood data science team. Full methodology and findings: political spectrum map.
Methodology reviewed by the BestNeighborhood data team. Last updated May 2026.