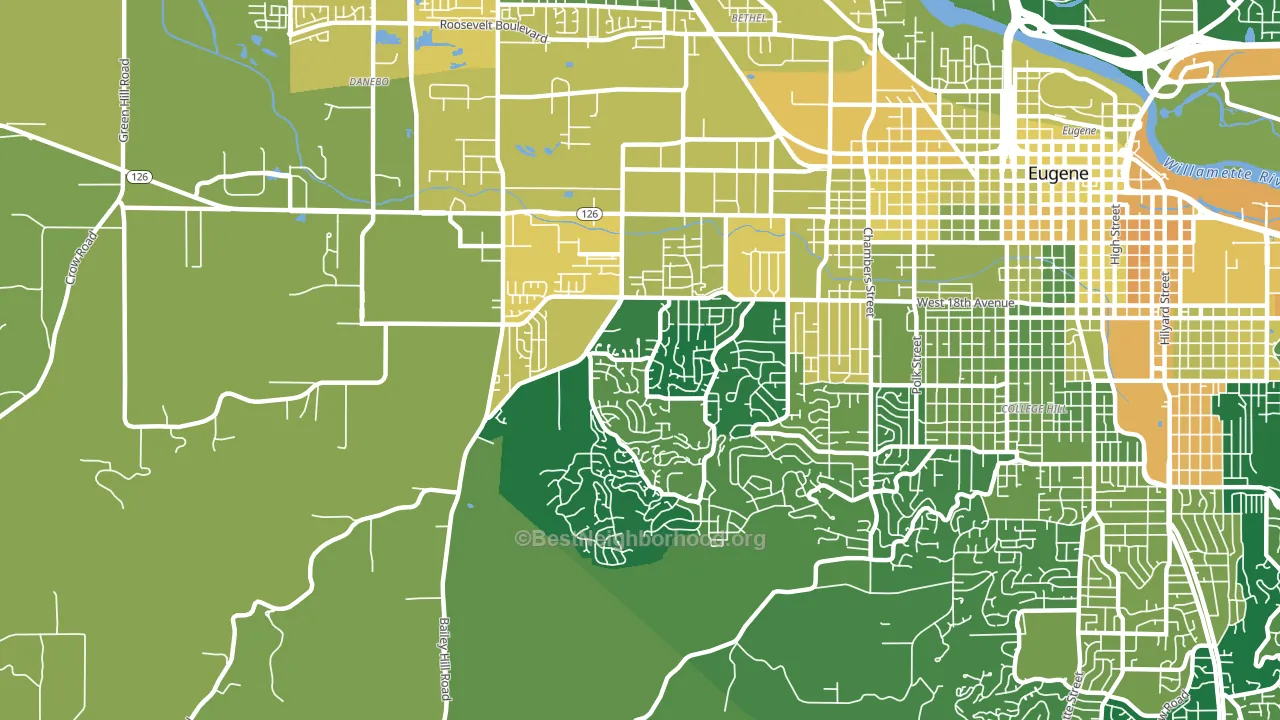
Churchill leans heavily Democratic by roughly 46 points: about 73% of voters vote Democratic and 27% Republican.
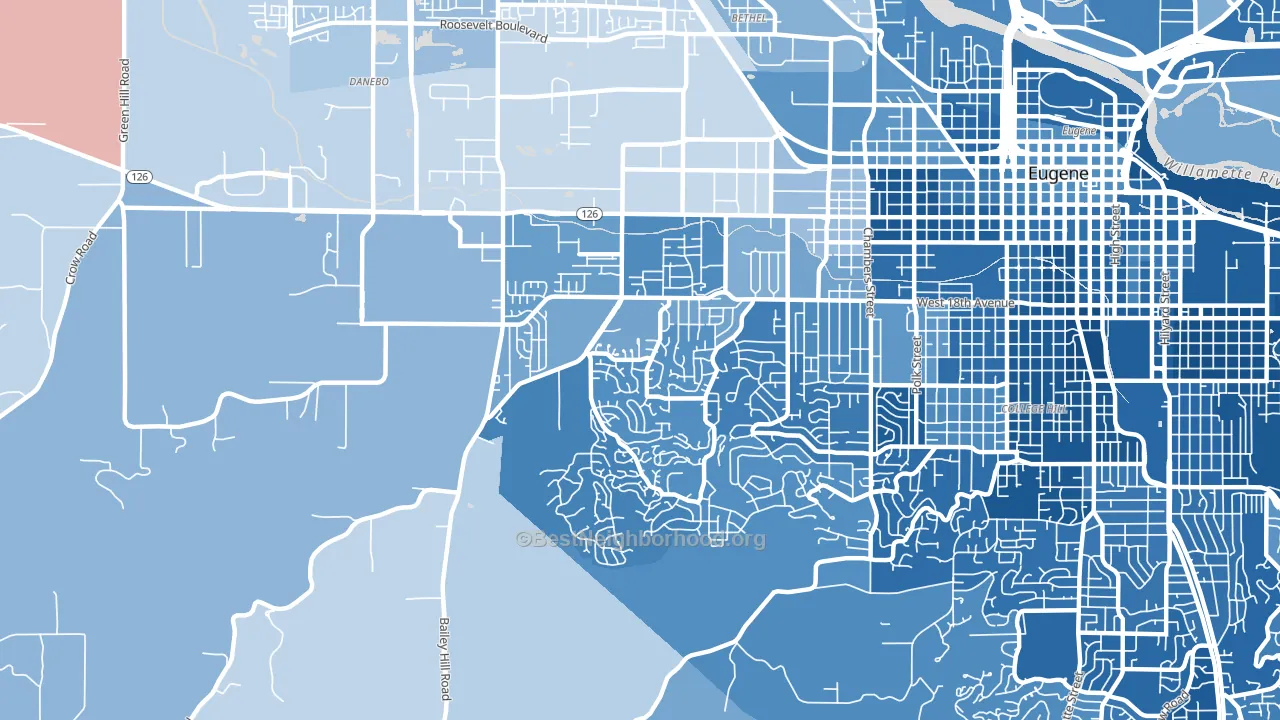
About 80% of adults in Churchill typically vote, above the U.S. average of about 62%. Among adults in Churchill, ~58% vote Democratic, ~22% Republican, and ~20% don't vote. The map below shows estimated turnout by block group.
How Churchill compares
Among neighborhoods within 5 miles, Churchill leans more Democratic than 5 of 15 neighbors.
Churchill runs about 31 points more Democratic than Oregon as a whole.
Politics vary noticeably by block within Churchill. The east side is the most Democratic-leaning (D+62) and the northwest side is the least Democratic-leaning (D+33), a spread of about 29 points.
Why Churchill leans the way it does
Density, race composition, education, and family structure all sit close to their national averages in Churchill. The lean here lands roughly where demographic data alone would predict.
Uninsured rate and voter turnout
Places with a low uninsured rate tend to turn out at a higher rate; Churchill, Eugene, OR sits in the bottom quarter nationally on this measure. Insurance coverage does not directly drive turnout; it reflects the income and stability that line up with who votes.
Why turnout in Churchill looks the way it does
Turnout in Churchill sits close to the national pattern. Routine healthcare access, homeownership, education, and food security all land near their national averages here. Learn more about the findings and methodology on the political spectrum map.
Nearby Neighborhoods
- Far West Eugene, Eugene, OR D+46
- West Eugene, Eugene, OR D+53
- Crest Drive, Eugene, OR D+65
- Friendly, Eugene, OR D+70
- Jefferson Westside, Eugene, OR D+71
- Whiteaker, Eugene, OR D+62
- West University, Eugene, OR D+62
- Active Bethel, Eugene, OR D+8
- South University, Eugene, OR D+74
- River Road, Eugene, OR D+26
Neighborhoods with Similar Populations
- Moran Prairie, Spokane, WA D+18
- Magruder, Hampton, VA D+47
- Artesia Pilar, Santa Ana, CA D+31
- Pleasant Grove West, Chesapeake, VA R+31
- Southwest Topeka, Topeka, KS D+8
- Edison Park, Chicago, IL D+5
- Garfield Manor, Chicago, IL D+38
- Poplar Grove, Salt Lake City, UT D+34
- River Road, Eugene, OR D+26
- Cambridgeport, Cambridge, MA D+77
Sources and methodology
Precinct-level voting records used to fit the model come from Oregon Secretary of State, Elections Division, distributed by the Voting and Election Science Team. Demographic inputs come from the U.S. Census Bureau (ACS 5-year estimates and the 2020 Decennial Census). Health and environmental inputs come from the CDC (PLACES and the Environmental Justice Index). Land cover comes from the USGS and EPA. Election-day and lead-up weather come from PRISM 4km daily grids and the NOAA Global Historical Climatology Network. Mail-voting and election-administration patterns come from the MIT Election Lab's Survey of the Performance of American Elections. Block-group crime detail comes from CrimeGrade. Internet data and modeling support provided by ISPreports.org.
Modeling and analysis by the BestNeighborhood data science team. Full methodology and findings: political spectrum map.
Methodology reviewed by the BestNeighborhood data team. Last updated May 2026.