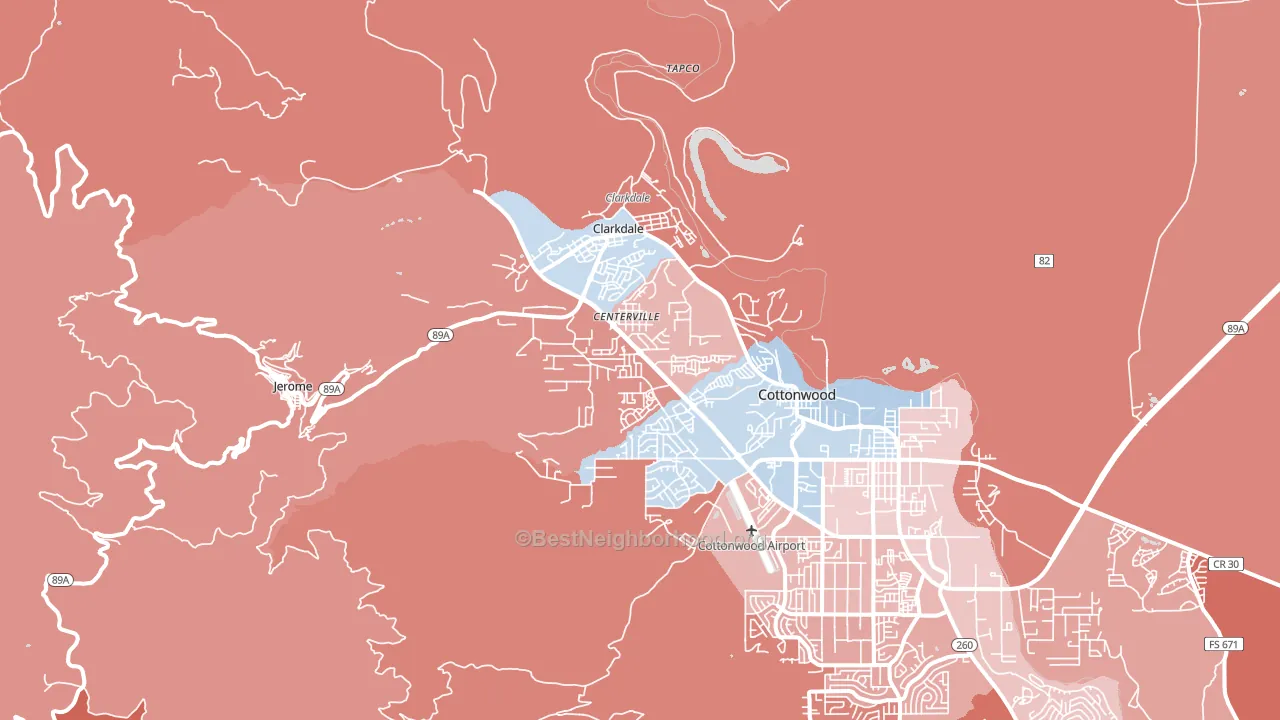
Clarkdale leans slightly Republican by roughly 14 points: about 43% of voters vote Democratic and 57% Republican.
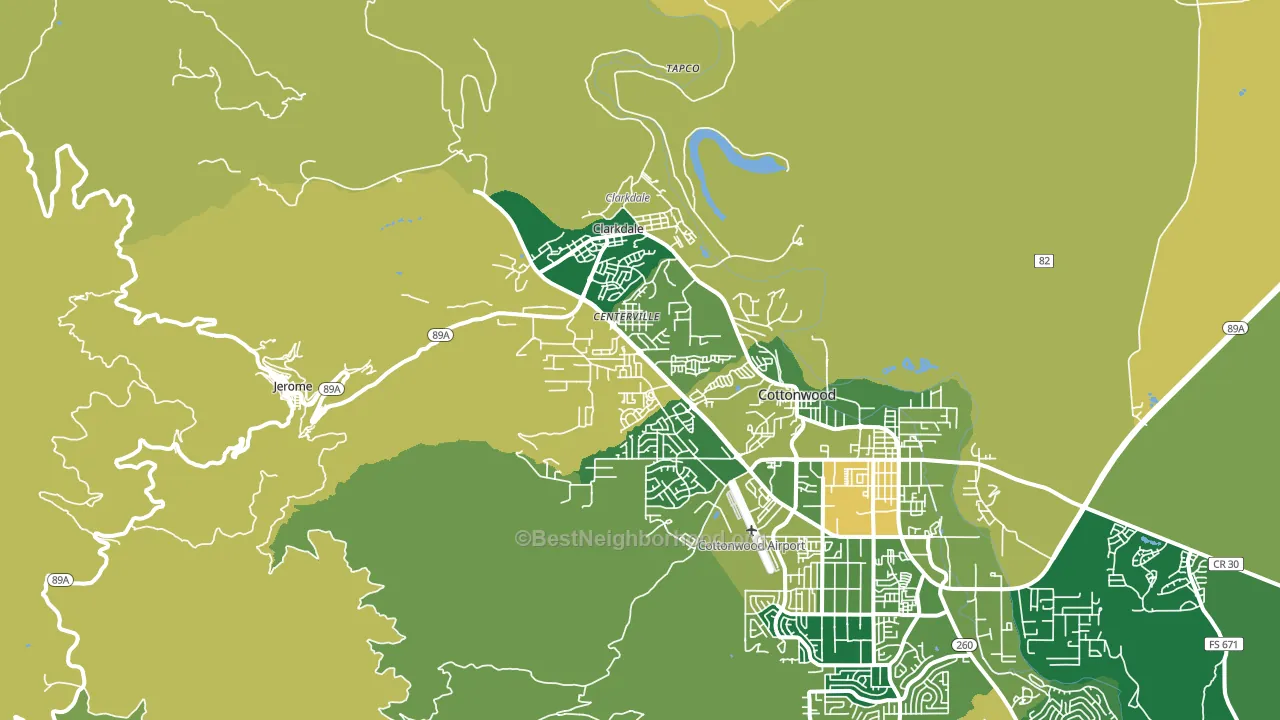
About 76% of adults in Clarkdale typically vote, above the U.S. average of about 62%. Among adults in Clarkdale, ~33% vote Democratic, ~43% Republican, and ~24% don't vote. The map below shows estimated turnout by block group.
How Clarkdale compares
Among cities within 25 miles, Clarkdale leans more Republican than 7 of 21 neighbors.
Clarkdale runs about 9 points more Republican than Arizona as a whole.
Politics vary noticeably by neighborhood within Clarkdale. The southwest side is the most Republican-leaning (R+23) and the northwest side is the least Republican-leaning (R+6), a spread of about 17 points.
Why Clarkdale leans the way it does
This analysis examined 14,881 data points per city to find what predicts political lean and turnout. The items below are a few correlations that stood out for Clarkdale, not a ranked or complete list of what matters most.
Clarkdale votes Republican even though it is densely developed (about 35%, above 82% of cities). Here an older population outweighs the Democratic lean that density usually predicts.
Population density and Democratic lean
Places with high population density tend to lean Democratic; Clarkdale, AZ sits in the top quarter nationally on this measure.
Why turnout in Clarkdale looks the way it does
Areas with high high-school completion turn out at higher rates. About 96% of adults in Clarkdale have completed high school, about 9 points above the Arizona average of 87%. Learn more about the findings and methodology on the political spectrum map.
Nearby Cities
- Cottonwood, AZ Even
- Verde Village, AZ R+14
- Jerome, AZ R+31
- Tapco, AZ R+18
- Cornville, AZ R+33
- Page Springs, AZ R+12
- Middle Verde, AZ R+14
- West Sedona, AZ D+4
- Rimrock, AZ R+33
- Big Park, AZ D+17
Cities with Similar Populations
- Cornville, AZ R+33
- Golden Triangle, NJ D+28
- Fouke, AR R+76
- Whittier, NC R+34
- Campbellsport, WI R+51
- Angie, LA R+28
- Westvale, NY D+22
- Margate City, NJ R+5
- Diana, TX R+74
- Butler Beach, FL R+27
Sources and methodology
Precinct-level voting records used to fit the model come from Arizona Secretary of State, Elections, distributed by the Voting and Election Science Team. Demographic inputs come from the U.S. Census Bureau (ACS 5-year estimates and the 2020 Decennial Census). Health and environmental inputs come from the CDC (PLACES and the Environmental Justice Index). Land cover comes from the USGS and EPA. Election-day and lead-up weather come from PRISM 4km daily grids and the NOAA Global Historical Climatology Network. Mail-voting and election-administration patterns come from the MIT Election Lab's Survey of the Performance of American Elections. Block-group crime detail comes from CrimeGrade. Internet data and modeling support provided by ISPreports.org.
Modeling and analysis by the BestNeighborhood data science team. Full methodology and findings: political spectrum map.
Methodology reviewed by the BestNeighborhood data team. Last updated May 2026.