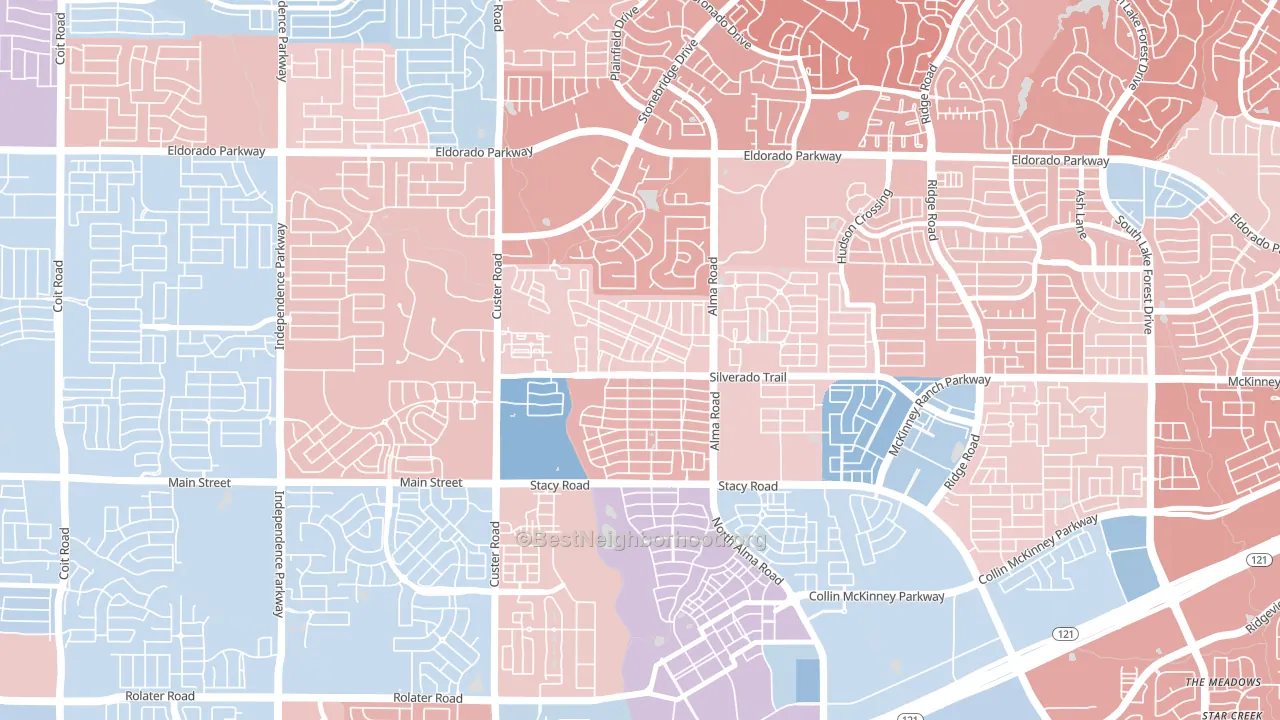
Craig Ranch North is a true toss-up. About 48% of voters here vote Democratic and 52% Republican.
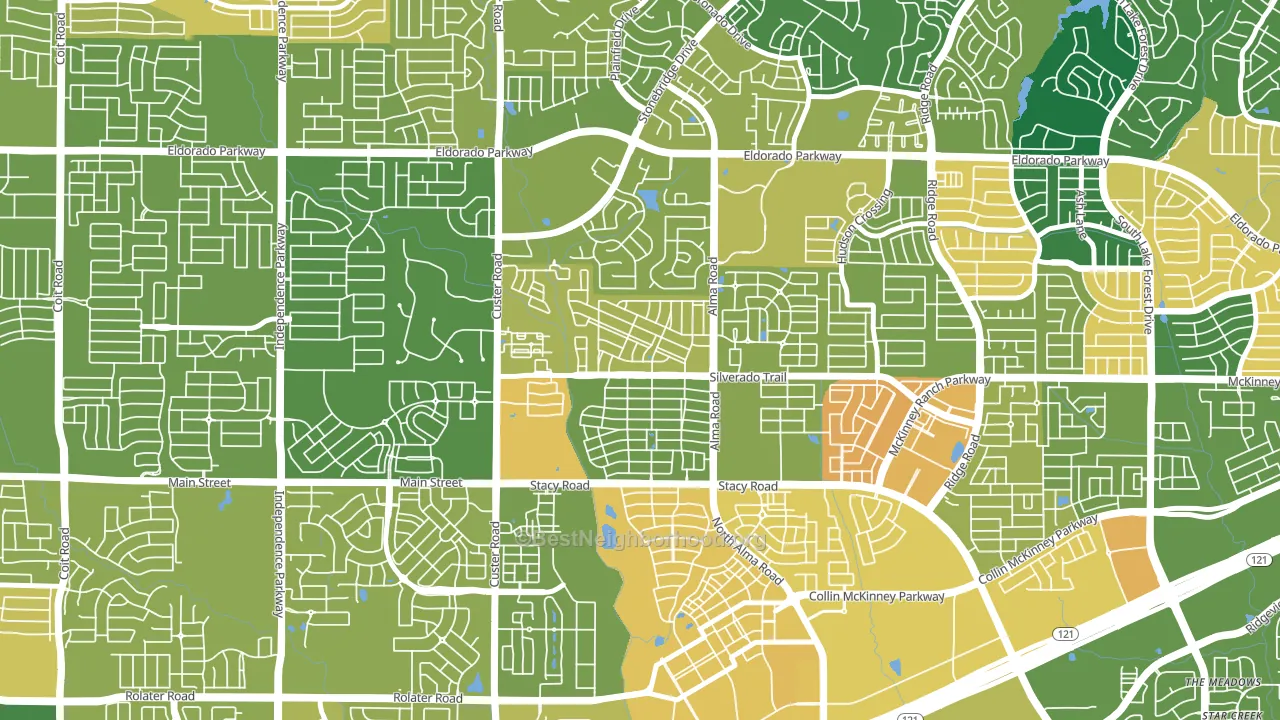
About 76% of adults in Craig Ranch North typically vote, above the U.S. average of about 62%. Among adults in Craig Ranch North, ~36% vote Democratic, ~40% Republican, and ~24% don't vote. The map below shows estimated turnout by block group.
How Craig Ranch North compares
Craig Ranch North sits in a sparsely populated area with few comparable neighborhoods nearby.
Craig Ranch North runs about 10 points more Democratic than Texas as a whole.
Why Craig Ranch North leans the way it does
Density, race composition, education, and family structure all sit close to their national averages in Craig Ranch North. The lean here lands roughly where demographic data alone would predict.
Preventive-care access and voter turnout
Places with strong routine preventive-care access tend to turn out at a higher rate; Craig Ranch North, McKinney, TX sits above the national average on this measure. Dental visits do not drive turnout; the rate reflects income, insurance, and healthcare access, which line up with who votes.
Why turnout in Craig Ranch North looks the way it does
Turnout in Craig Ranch North sits close to the national pattern. Routine healthcare access, homeownership, education, and food security all land near their national averages here. Learn more about the findings and methodology on the political spectrum map.
Nearby Neighborhoods
- Village Park, McKinney, TX D+2
- Eldorado Heights, McKinney, TX R+5
- Greens of McKinney, McKinney, TX R+2
- The Canal on Preston, Plano, TX D+8
- The Ws, The Colony, TX R+9
- Northeast Dallas, Carrollton, TX D+4
- Far North Dallas-Richardson, Richardson, TX D+29
- Far North Dallas, Dallas, TX D+21
- Far North Dallas-Carrollton, Carrollton, TX D+11
- Apollo Arapaho and Camelot, Garland, TX D+16
Neighborhoods with Similar Populations
- Springvale, San Antonio, TX D+19
- Fort Phantom Area, Abilene, TX D+3
- Ingram Hills, San Antonio, TX D+24
- Traditions, Aurora, CO D+14
- College Park, College Station, TX D+34
- North Hill, Des Moines, WA D+23
- Downtown Lorain, Lorain, OH D+15
- Eliot, Portland, OR D+79
- Eisenhower East, Alexandria, VA D+52
- Sunnyside-Flagstaff, Flagstaff, AZ D+35
Sources and methodology
Precinct-level voting records used to fit the model come from Texas Secretary of State, Elections Division, distributed by the Voting and Election Science Team. Demographic inputs come from the U.S. Census Bureau (ACS 5-year estimates and the 2020 Decennial Census). Health and environmental inputs come from the CDC (PLACES and the Environmental Justice Index). Land cover comes from the USGS and EPA. Election-day and lead-up weather come from PRISM 4km daily grids and the NOAA Global Historical Climatology Network. Mail-voting and election-administration patterns come from the MIT Election Lab's Survey of the Performance of American Elections. Block-group crime detail comes from CrimeGrade. Internet data and modeling support provided by ISPreports.org.
Modeling and analysis by the BestNeighborhood data science team. Full methodology and findings: political spectrum map.
Methodology reviewed by the BestNeighborhood data team. Last updated May 2026.