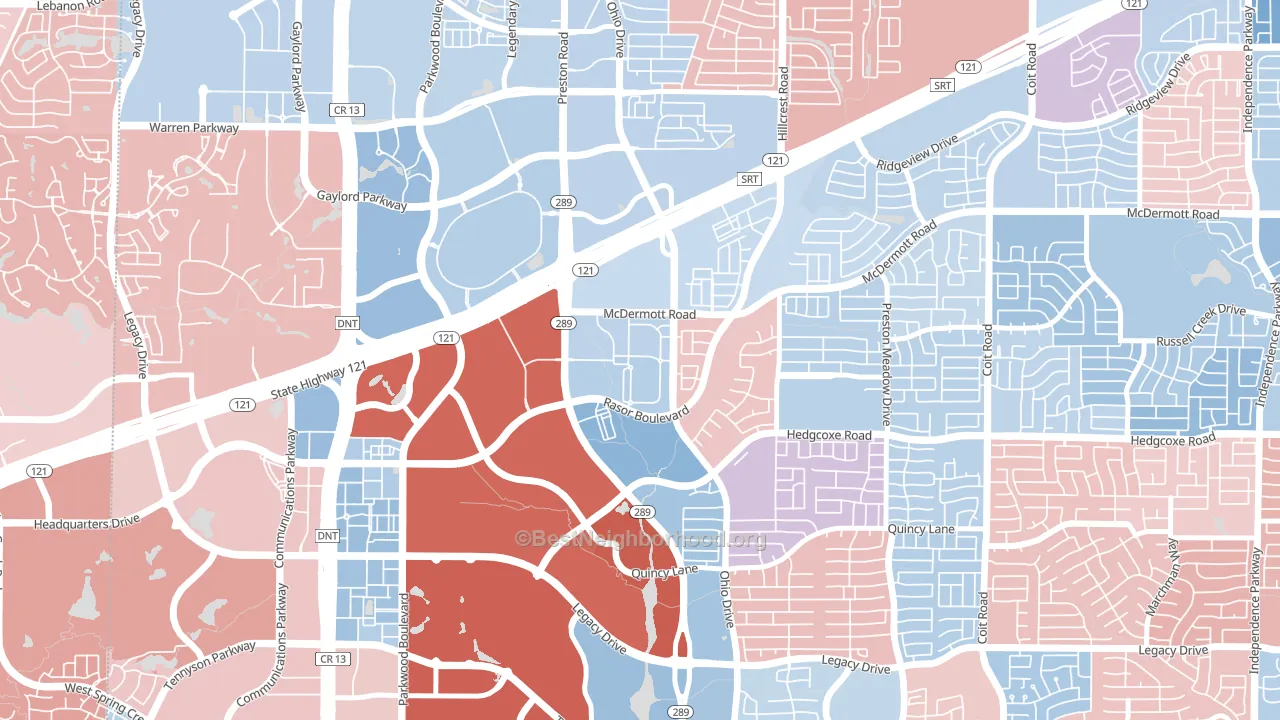
The Canal on Preston leans slightly Democratic by roughly 8 points: about 54% of voters vote Democratic and 46% Republican.
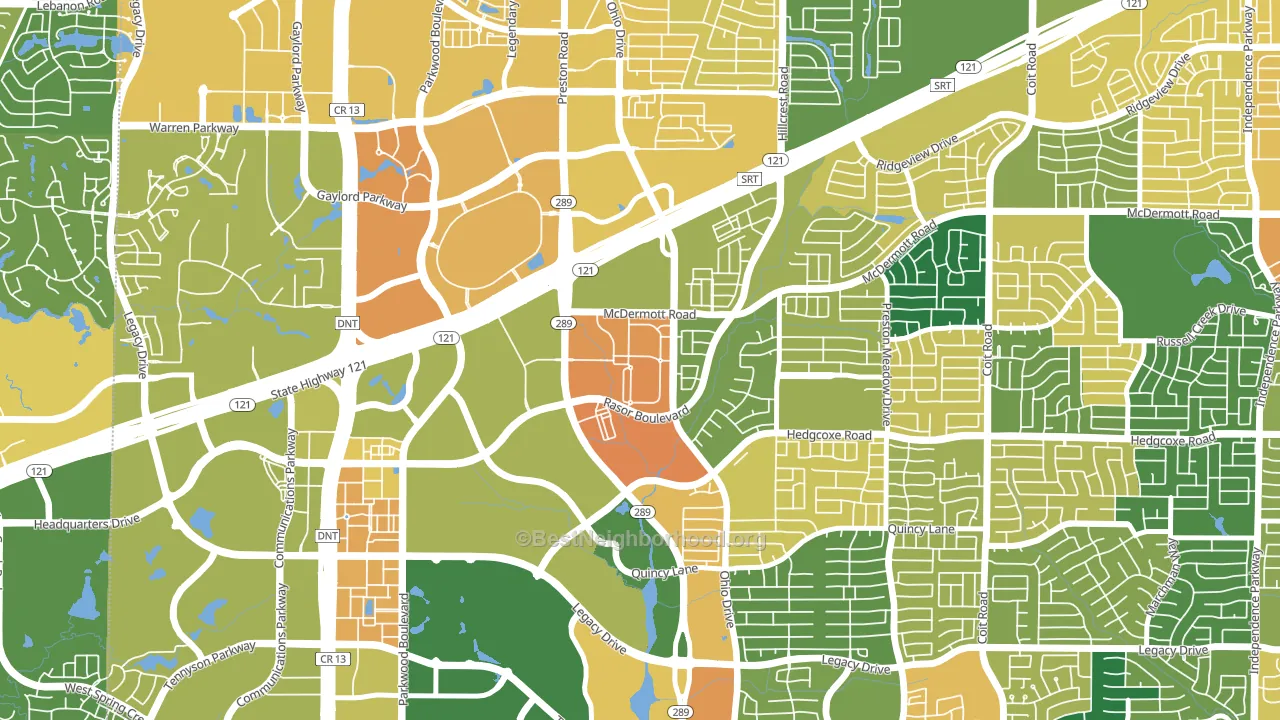
About 31% of adults in The Canal on Preston typically vote, below the U.S. average of about 62%. Among adults in The Canal on Preston, ~17% vote Democratic, ~14% Republican, and ~69% don't vote. The map below shows estimated turnout by block group.
How The Canal on Preston compares
The Canal on Preston runs about 21 points more Democratic than Texas as a whole. Texas leans Republican overall, while The Canal on Preston is one of the few Democratic-leaning pockets.
Why The Canal on Preston leans the way it does
This analysis examined 14,881 data points per neighborhood to find what predicts political lean and turnout. The items below are a few correlations that stood out for The Canal on Preston, not a ranked or complete list of what matters most.
Areas with high college attainment vote Democratic. About 83% of adults in The Canal on Preston hold a bachelor's degree, about 55 points above the U.S. average of 28%. Dense areas vote Democratic, and The Canal on Preston sits in the top fifth on density (more than 99%, above 89% of neighborhoods). The Canal on Preston runs against the grain of Texas, a Democratic-leaning pocket in a Republican-leaning state.
Paved land cover and Democratic lean
Places with extensive paved surfaces tend to lean Democratic; The Canal on Preston, Plano, TX sits in the top tenth nationally on this measure. Paved ground does not change how people vote; it mostly reflects how urban and built-up a place is.
Why turnout in The Canal on Preston looks the way it does
Renters vote less often than owners. More than 99% of households in The Canal on Preston rent, about 75 points above the U.S. average of 25%. Learn more about the findings and methodology on the political spectrum map.
Nearby Neighborhoods
- The Ws, The Colony, TX R+9
- Northeast Dallas, Carrollton, TX D+4
- Craig Ranch North, McKinney, TX R+4
- Far North Dallas-Carrollton, Carrollton, TX D+11
- Village Park, McKinney, TX D+2
- North Central Dallas, Carrollton, TX D+8
- Far North Dallas, Dallas, TX D+21
- Eldorado Heights, McKinney, TX R+5
- Far North Dallas-Richardson, Richardson, TX D+29
- Southwest Carrollton, Carrollton, TX D+13
Neighborhoods with Similar Populations
- Forrest Hills, Augusta, GA D+29
- Silver Valley Addition, Sioux Falls, SD R+12
- Brooklyn, Portland, OR D+81
- Southpointe, Fargo, ND D+5
- Slabtown, Portland, OR D+78
- Forest Glen, Silver Spring, MD D+75
- Atchison Woods, Richmond, CA D+55
- Lamberts Point, Norfolk, VA D+67
- Midtown, Anchorage, AK D+42
- Westies, Wausau, WI D+11
Sources and methodology
Precinct-level voting records used to fit the model come from Texas Secretary of State, Elections Division, distributed by the Voting and Election Science Team. Demographic inputs come from the U.S. Census Bureau (ACS 5-year estimates and the 2020 Decennial Census). Health and environmental inputs come from the CDC (PLACES and the Environmental Justice Index). Land cover comes from the USGS and EPA. Election-day and lead-up weather come from PRISM 4km daily grids and the NOAA Global Historical Climatology Network. Mail-voting and election-administration patterns come from the MIT Election Lab's Survey of the Performance of American Elections. Block-group crime detail comes from CrimeGrade. Internet data and modeling support provided by ISPreports.org.
Modeling and analysis by the BestNeighborhood data science team. Full methodology and findings: political spectrum map.
Methodology reviewed by the BestNeighborhood data team. Last updated May 2026.