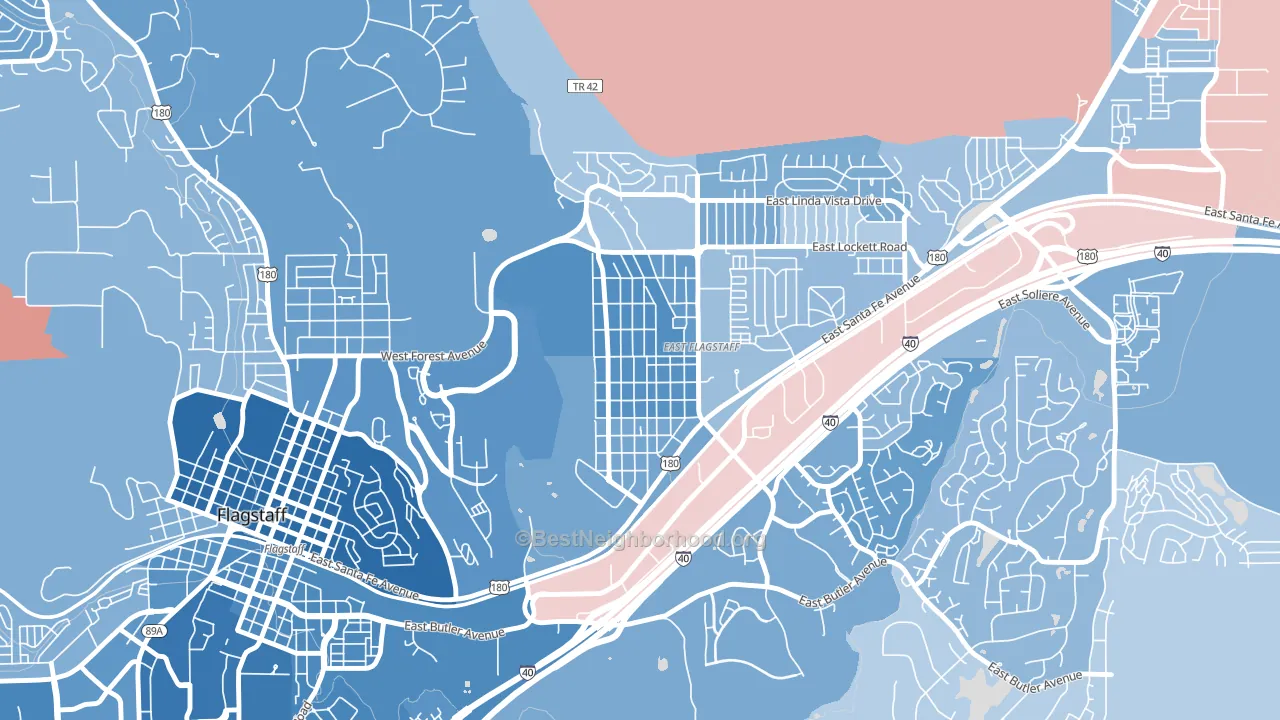
Sunnyside-Flagstaff leans heavily Democratic by roughly 34 points: about 67% of voters vote Democratic and 33% Republican.
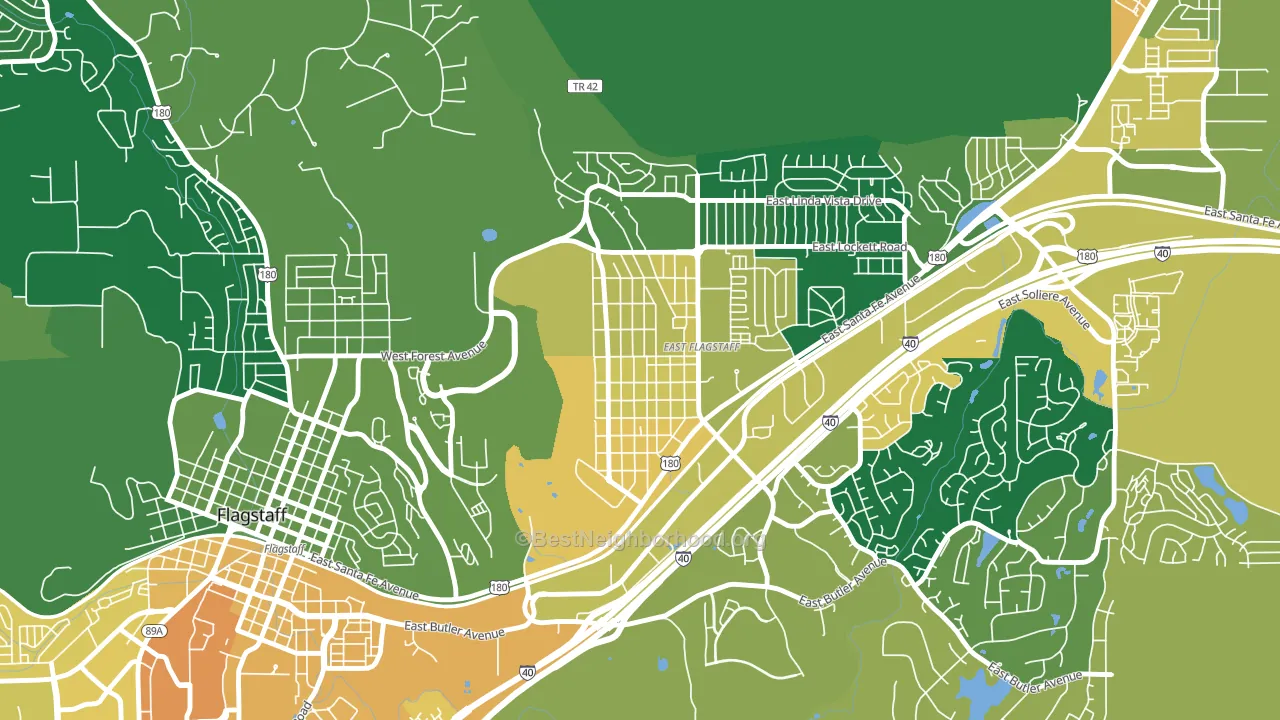
About 55% of adults in Sunnyside-Flagstaff typically vote, below the U.S. average of about 62%. Among adults in Sunnyside-Flagstaff, ~37% vote Democratic, ~18% Republican, and ~45% don't vote. The map below shows estimated turnout by block group.
How Sunnyside-Flagstaff compares
Among neighborhoods within 5 miles, Sunnyside-Flagstaff is the least Democratic-leaning.
Sunnyside-Flagstaff runs about 40 points more Democratic than Arizona as a whole. Arizona leans Republican overall, while Sunnyside-Flagstaff is one of the few Democratic-leaning pockets.
Politics vary noticeably by block within Sunnyside-Flagstaff. The northwest side is the most Democratic-leaning (D+45) and the southeast side is the least Democratic-leaning (D+25), a spread of about 20 points.
Why Sunnyside-Flagstaff leans the way it does
This analysis examined 14,881 data points per neighborhood to find what predicts political lean and turnout. The items below are a few correlations that stood out for Sunnyside-Flagstaff, not a ranked or complete list of what matters most.
Sunnyside-Flagstaff votes against the grain of Arizona. Arizona leans Republican overall, while Sunnyside-Flagstaff runs about 40 points more Democratic. A high never-married share predicts Democratic voting, and about 57% of adults in Sunnyside-Flagstaff have never been married, above 90% of neighborhoods.
Preventive-care access and voter turnout
Places with limited routine preventive-care access tend to turn out at a lower rate; Sunnyside-Flagstaff, Flagstaff, AZ sits below the national average on this measure. Dental visits do not drive turnout; the rate reflects income, insurance, and healthcare access, which line up with who votes.
Why turnout in Sunnyside-Flagstaff looks the way it does
Renters vote less often than owners. About 78% of households in Sunnyside-Flagstaff rent, about 53 points above the U.S. average of 25%. Crowded housing lines up with lower turnout, and about 10% of homes in Sunnyside-Flagstaff have more than one occupant per room, above 91% of neighborhoods. High-crime urban areas turn out at lower rates, and Sunnyside-Flagstaff sits in the top 15% on a violent-crime measure. Learn more about the findings and methodology on the political spectrum map.
Nearby Neighborhoods
- South Flagstaff, Flagstaff, AZ D+51
- Northern Arizona University, Flagstaff, AZ D+63
- Woodlands Village, Flagstaff, AZ D+38
- Granville, Prescott Valley, AZ R+18
- New Village, New River, AZ R+30
- Pinnacle Peak, Scottsdale, AZ R+22
- Desert Hills, Cave Creek, AZ R+23
- North Gateway, Phoenix, AZ R+14
- Desert View, Phoenix, AZ R+12
- Vistancia, Peoria, AZ R+21
Neighborhoods with Similar Populations
- Eisenhower East, Alexandria, VA D+52
- Marlton, Camden, NJ D+62
- Downtown Lorain, Lorain, OH D+15
- North Hill, Des Moines, WA D+23
- College Park, College Station, TX D+34
- Ogden, Vancouver, WA D+20
- Stonybrook-Wilshire, York, PA R+15
- Pheasant Run, Aurora, CO D+15
- Ingram Hills, San Antonio, TX D+24
- Springvale, San Antonio, TX D+19
Sources and methodology
Precinct-level voting records used to fit the model come from Arizona Secretary of State, Elections, distributed by the Voting and Election Science Team. Demographic inputs come from the U.S. Census Bureau (ACS 5-year estimates and the 2020 Decennial Census). Health and environmental inputs come from the CDC (PLACES and the Environmental Justice Index). Land cover comes from the USGS and EPA. Election-day and lead-up weather come from PRISM 4km daily grids and the NOAA Global Historical Climatology Network. Mail-voting and election-administration patterns come from the MIT Election Lab's Survey of the Performance of American Elections. Block-group crime detail comes from CrimeGrade. Internet data and modeling support provided by ISPreports.org.
Modeling and analysis by the BestNeighborhood data science team. Full methodology and findings: political spectrum map.
Methodology reviewed by the BestNeighborhood data team. Last updated May 2026.