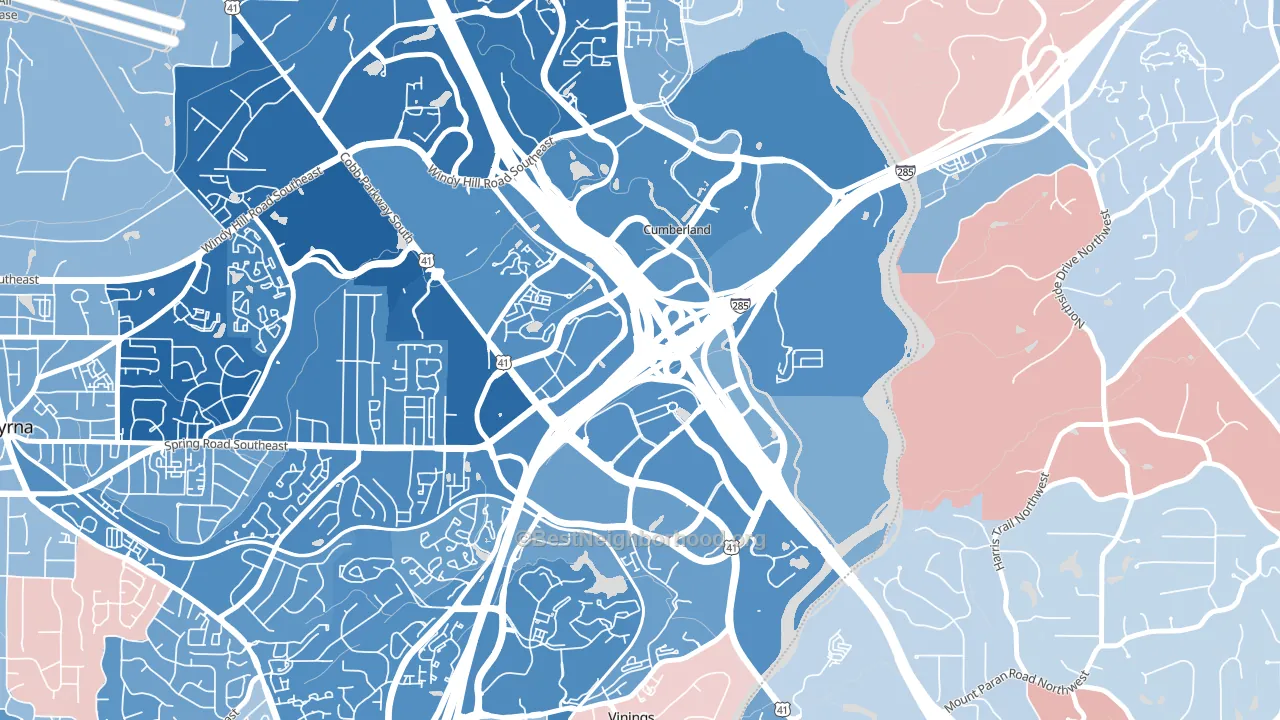
Cumberland leans heavily Democratic by roughly 44 points: about 72% of voters vote Democratic and 28% Republican.
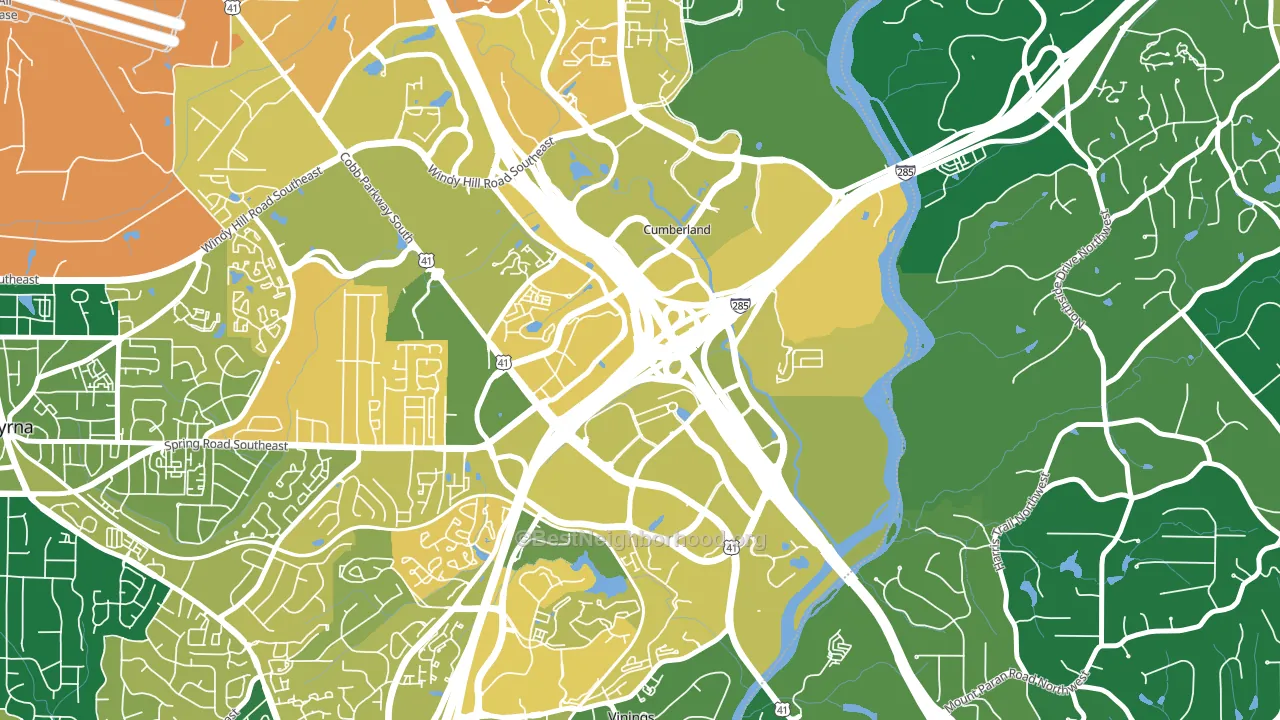
About 58% of adults in Cumberland typically vote, near the U.S. average of about 62%. Among adults in Cumberland, ~42% vote Democratic, ~16% Republican, and ~42% don't vote. The map below shows estimated turnout by block group.
How Cumberland compares
Cumberland runs about 45 points more Democratic than Georgia as a whole. Georgia is roughly evenly split, and Cumberland sits clearly on the Democratic side.
Why Cumberland leans the way it does
This analysis examined 14,881 data points per neighborhood to find what predicts political lean and turnout. The items below are a few correlations that stood out for Cumberland, not a ranked or complete list of what matters most.
Areas with high college attainment vote Democratic. About 74% of adults in Cumberland hold a bachelor's degree, about 46 points above the U.S. average of 28%. A high never-married share predicts Democratic voting, and about 59% of adults in Cumberland have never been married, above 92% of neighborhoods. Cumberland runs against the grain of Georgia, a Democratic-leaning outlier in a roughly evenly split state.
Population density and Democratic lean
Places with high population density tend to lean Democratic; Cumberland, Atlanta, GA sits above the national average on this measure.
Why turnout in Cumberland looks the way it does
Renters vote less often than owners. About 85% of households in Cumberland rent, about 60 points above the U.S. average of 25%. Learn more about the findings and methodology on the political spectrum map.
Nearby Neighborhoods
- Highlands Park, Smyrna, GA D+44
- Oakdale, Atlanta, GA D+24
- Buckhead, Atlanta, GA D+23
- Rockdale, Atlanta, GA D+58
- Perimeter Center, Sandy Springs, GA D+33
- The Meadows, Sandy Springs, GA D+29
- Trowbridge Square, Sandy Springs, GA D+62
- Home Park, Atlanta, GA D+60
- Center Hill, Atlanta, GA D+87
- Morningside-Lenox Park, Atlanta, GA D+46
Neighborhoods with Similar Populations
- Columbia Street Waterfront District, Brooklyn, NY D+78
- Bricktown, Chicago, IL D+64
- Bryn Mawr, Yonkers, NY D+6
- San Andreas, Highland, CA D+13
- Walnut Grove, Broomfield, CO D+15
- Polonia, Milwaukee, WI D+32
- SBHS, San Bernardino, CA D+27
- South Main, Houston, TX D+60
- Hamilton Main Street Historic District, Hamilton, OH R+14
- Seward, Minneapolis, MN D+78
Sources and methodology
Precinct-level voting records used to fit the model come from Georgia Elections Division, distributed by the Voting and Election Science Team. Demographic inputs come from the U.S. Census Bureau (ACS 5-year estimates and the 2020 Decennial Census). Health and environmental inputs come from the CDC (PLACES and the Environmental Justice Index). Land cover comes from the USGS and EPA. Election-day and lead-up weather come from PRISM 4km daily grids and the NOAA Global Historical Climatology Network. Mail-voting and election-administration patterns come from the MIT Election Lab's Survey of the Performance of American Elections. Block-group crime detail comes from CrimeGrade. Internet data and modeling support provided by ISPreports.org.
Modeling and analysis by the BestNeighborhood data science team. Full methodology and findings: political spectrum map.
Methodology reviewed by the BestNeighborhood data team. Last updated May 2026.