Highlands Park leans heavily Democratic by roughly 44 points: about 72% of voters vote Democratic and 28% Republican.
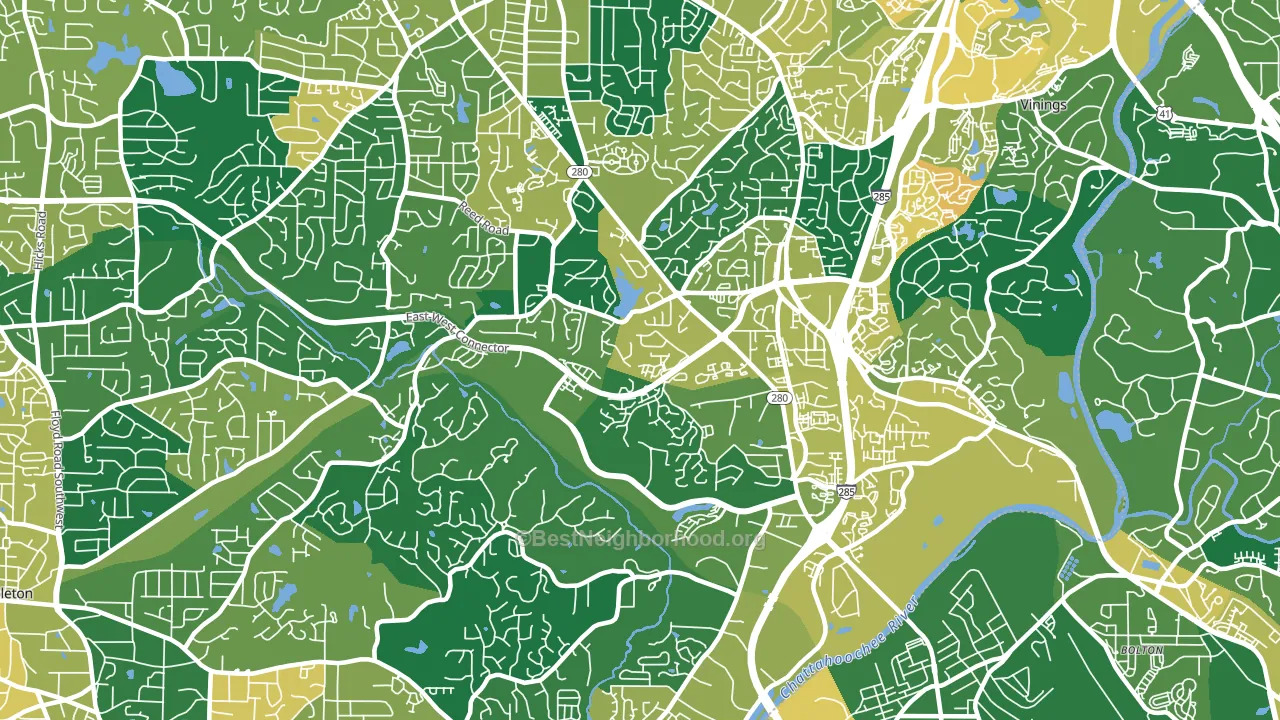
About 84% of adults in Highlands Park typically vote, above the U.S. average of about 62%. Among adults in Highlands Park, ~61% vote Democratic, ~24% Republican, and ~15% don't vote. The map below shows estimated turnout by block group.
How Highlands Park compares
Among neighborhoods within 5 miles, Highlands Park leans more Democratic than 2 of 4 neighbors.
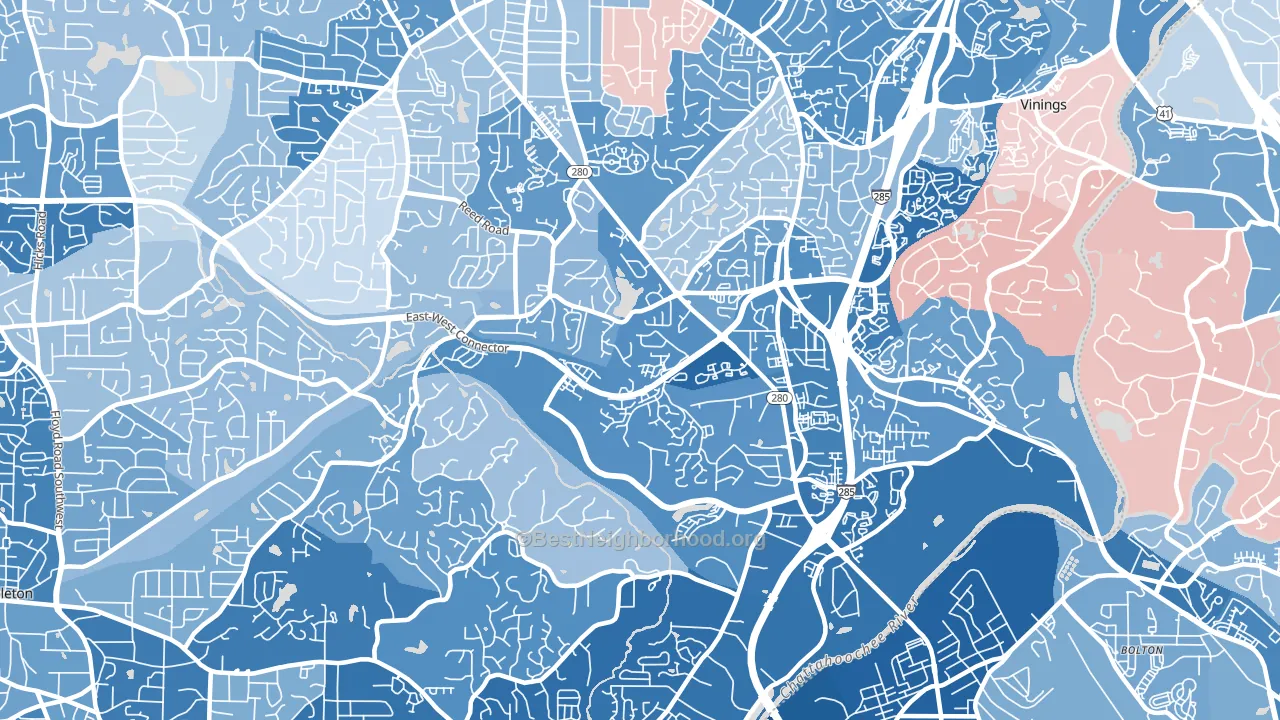
Highlands Park runs about 46 points more Democratic than Georgia as a whole. Georgia is roughly evenly split, and Highlands Park sits clearly on the Democratic side.
Politics vary noticeably by block within Highlands Park. The east side is the most Democratic-leaning (D+68) and the northwest side is the least Democratic-leaning (D+28), a spread of about 40 points.
Why Highlands Park leans the way it does
This analysis examined 14,881 data points per neighborhood to find what predicts political lean and turnout. The items below are a few correlations that stood out for Highlands Park, not a ranked or complete list of what matters most.
Areas with high college attainment vote Democratic. About 66% of adults in Highlands Park hold a bachelor's degree, about 37 points above the U.S. average of 28%. Highlands Park runs against the grain of Georgia, a Democratic-leaning outlier in a roughly evenly split state.
Preventive-care access and voter turnout
Places with strong routine preventive-care access tend to turn out at a higher rate; Highlands Park, Smyrna, GA sits above the national average on this measure. Dental visits do not drive turnout; the rate reflects income, insurance, and healthcare access, which line up with who votes.
Why turnout in Highlands Park looks the way it does
Turnout in Highlands Park sits close to the national pattern. Routine healthcare access, homeownership, education, and food security all land near their national averages here. Learn more about the findings and methodology on the political spectrum map.
Nearby Neighborhoods
- Cumberland, Atlanta, GA D+43
- Rockdale, Atlanta, GA D+58
- Center Hill, Atlanta, GA D+87
- Oakdale, Atlanta, GA D+24
- Grove Park, Atlanta, GA D+85
- Adamsville, Atlanta, GA D+86
- Home Park, Atlanta, GA D+60
- Cascade Heights, Atlanta, GA D+87
- Buckhead, Atlanta, GA D+23
- Vine City, Atlanta, GA D+78
Neighborhoods with Similar Populations
- Doylestown Historic District, Doylestown, PA D+26
- Central West, Trenton, NJ D+79
- Beacon Hills and Harbour, Jacksonville, FL R+27
- Sierra Oaks, Sacramento, CA D+42
- Alessandro Heights, Riverside, CA R+18
- Fry Springs, Charlottesville, VA D+68
- Trinity Park, Durham, NC D+86
- Payette Heights, Payette, ID R+51
- East Winston, Winston-Salem, NC D+82
- Tall Grass, Naperville, IL D+19
Sources and methodology
Precinct-level voting records used to fit the model come from Georgia Elections Division, distributed by the Voting and Election Science Team. Demographic inputs come from the U.S. Census Bureau (ACS 5-year estimates and the 2020 Decennial Census). Health and environmental inputs come from the CDC (PLACES and the Environmental Justice Index). Land cover comes from the USGS and EPA. Election-day and lead-up weather come from PRISM 4km daily grids and the NOAA Global Historical Climatology Network. Mail-voting and election-administration patterns come from the MIT Election Lab's Survey of the Performance of American Elections. Block-group crime detail comes from CrimeGrade. Internet data and modeling support provided by ISPreports.org.
Modeling and analysis by the BestNeighborhood data science team. Full methodology and findings: political spectrum map.
Methodology reviewed by the BestNeighborhood data team. Last updated May 2026.