Dawes County leans heavily Republican by roughly 38 points: about 31% of voters vote Democratic and 69% Republican.
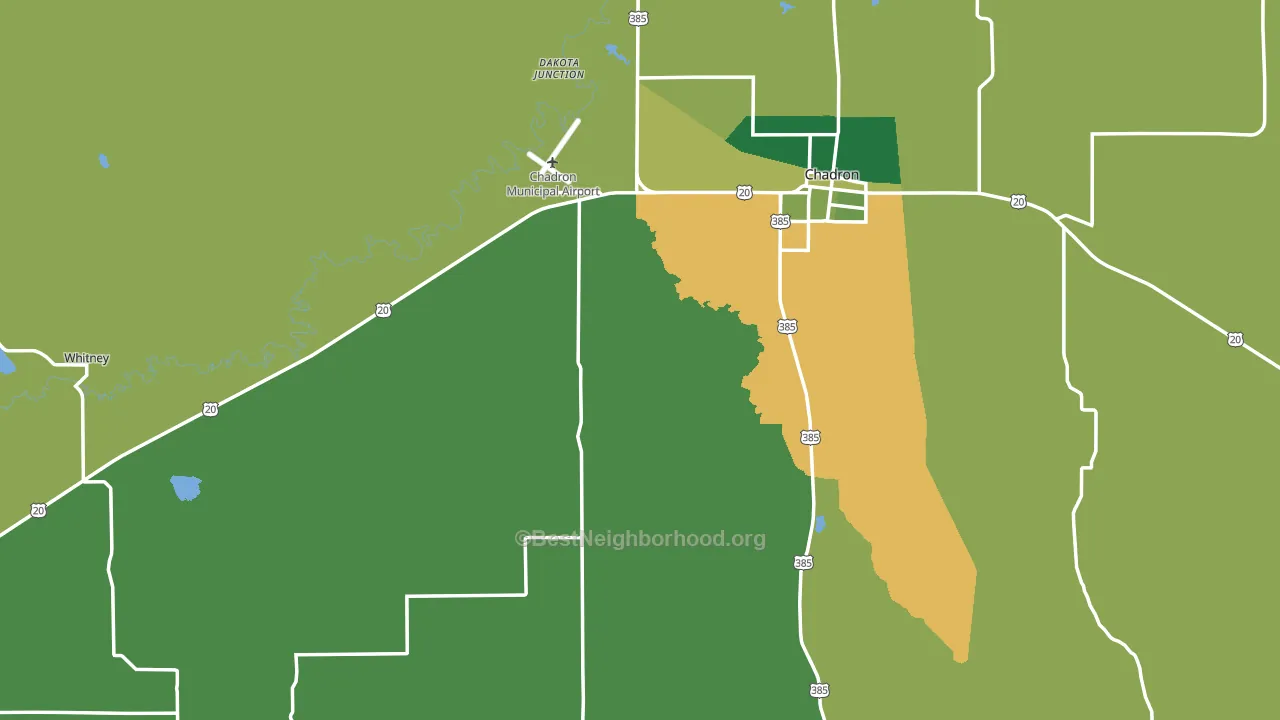
About 78% of adults in Dawes County typically vote, above the U.S. average of about 62%. Among adults in Dawes County, ~24% vote Democratic, ~54% Republican, and ~22% don't vote. The map below shows estimated turnout by block group.
How Dawes County compares
Among counties within 50 miles, Dawes County is the least Republican-leaning.
Dawes County runs about 18 points more Republican than Nebraska as a whole.
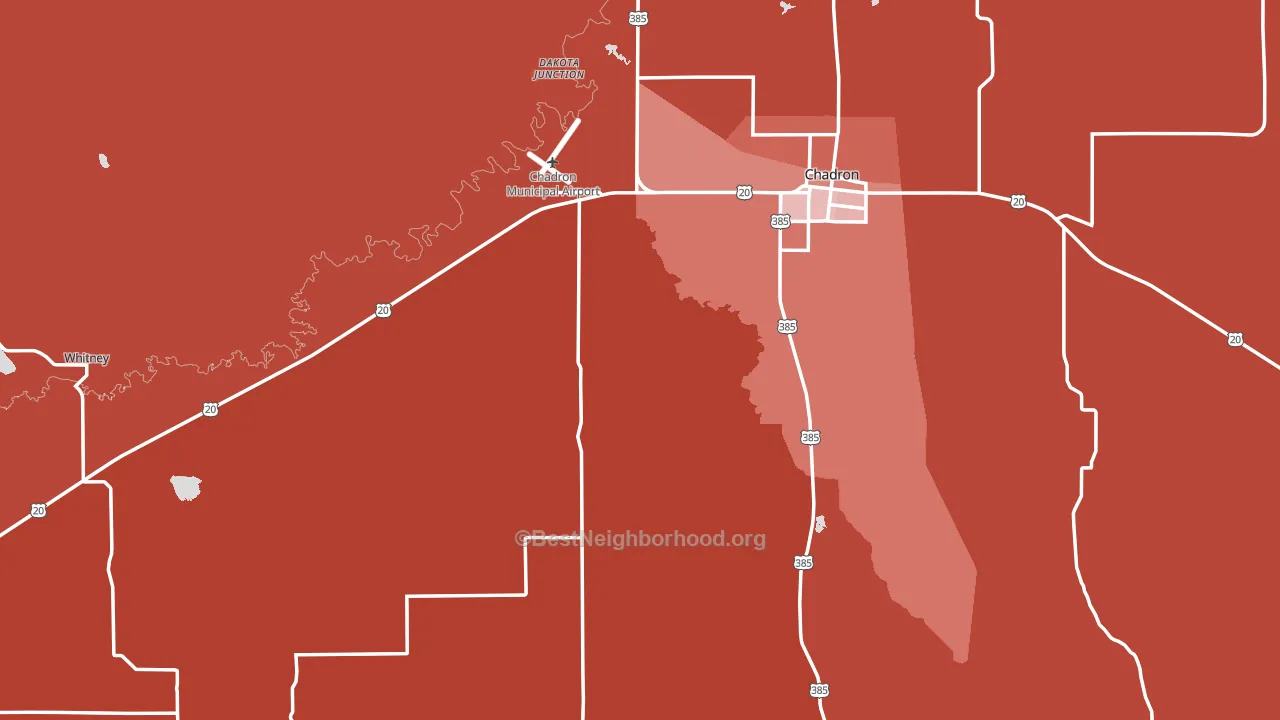
Politics vary noticeably by city within Dawes County. The south side is the most Republican-leaning (R+73) and the north side is the least Republican-leaning (R+28), a spread of about 44 points.
Why Dawes County leans the way it does
Density, race composition, education, and family structure all sit close to their national averages in Dawes County. The lean here lands roughly where demographic data alone would predict.
High-school completion, uninsured rate, and voter turnout
Places that combine high-school-completion-heavy adults and a low uninsured rate tend to turn out at a higher rate, as Dawes County, NE does.
Why turnout in Dawes County looks the way it does
Areas with high high-school completion turn out at higher rates. About 97% of adults in Dawes County have completed high school, about 7 points above the U.S. average of 90%. Learn more about the findings and methodology on the political spectrum map.
Nearby Counties
- Sheridan County, NE R+68
- Box Butte County, NE R+55
- Sioux County, NE R+79
- Fall River County, SD R+52
- Custer County, SD R+53
- Niobrara County, WY R+90
- Scotts Bluff County, NE R+42
- Bennett County, SD R+7
- Morrill County, NE R+64
- Goshen County, WY R+62
Counties with Similar Populations
- Franklin City, VA D+32
- Murray County, MN R+54
- Oscoda County, MI R+44
- Hamilton County, TX R+69
- Lafayette County, FL R+65
- Lake County, OR R+61
- Baraga County, MI R+14
- Harrison County, MO R+64
- Choctaw County, MS R+37
- Hickory County, MO R+62
Sources and methodology
Precinct-level voting records used to fit the model come from Nebraska Secretary of State, Elections, distributed by the Voting and Election Science Team. Demographic inputs come from the U.S. Census Bureau (ACS 5-year estimates and the 2020 Decennial Census). Health and environmental inputs come from the CDC (PLACES and the Environmental Justice Index). Land cover comes from the USGS and EPA. Election-day and lead-up weather come from PRISM 4km daily grids and the NOAA Global Historical Climatology Network. Mail-voting and election-administration patterns come from the MIT Election Lab's Survey of the Performance of American Elections. Block-group crime detail comes from CrimeGrade. Internet data and modeling support provided by ISPreports.org.
Modeling and analysis by the BestNeighborhood data science team. Full methodology and findings: political spectrum map.
Methodology reviewed by the BestNeighborhood data team. Last updated May 2026.