Delaware County is a Republican stronghold. About 21% of voters here vote Democratic and 79% Republican.
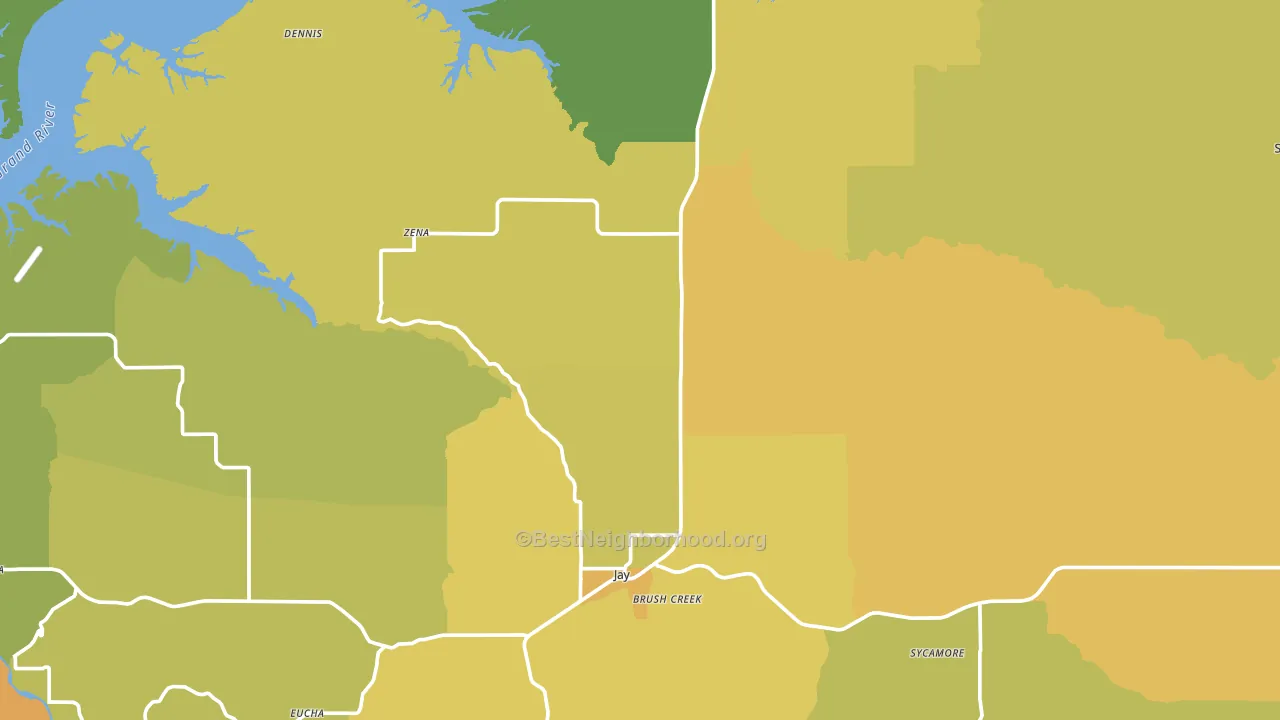
About 66% of adults in Delaware County typically vote, near the U.S. average of about 62%. Among adults in Delaware County, ~14% vote Democratic, ~52% Republican, and ~34% don't vote. The map below shows estimated turnout by block group.
How Delaware County compares
Among counties within 50 miles, Delaware County leans more Republican than 11 of 12 neighbors.
Delaware County runs about 9 points more Republican than Oklahoma as a whole.
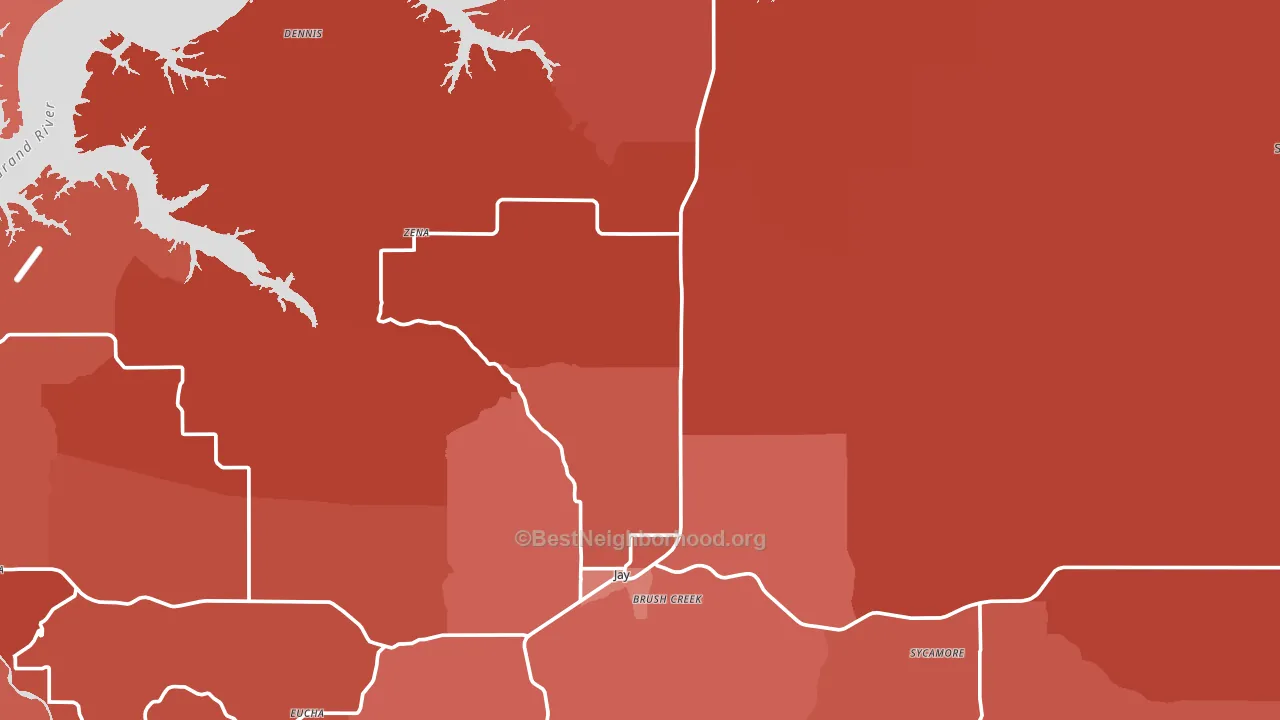
Politics vary noticeably by city within Delaware County. The southeast side is the most Republican-leaning (R+64) and the north side is the least Republican-leaning (R+51), a spread of about 14 points.
Why Delaware County leans the way it does
Density, race composition, education, and family structure all sit close to their national averages in Delaware County. The lean here lands roughly where demographic data alone would predict.
Never-married share, developed land, and voter turnout
Places that combine a low never-married share and a rural land-use pattern tend to turn out at a higher rate, as Delaware County, OK does.
Why turnout in Delaware County looks the way it does
Turnout in Delaware County sits close to the national pattern. Routine healthcare access, homeownership, education, and food security all land near their national averages here. Learn more about the findings and methodology on the political spectrum map.
Nearby Counties
- McDonald County, MO R+65
- Craig County, OK R+53
- Ottawa County, OK R+53
- Mayes County, OK R+56
- Benton County, AR R+26
- Newton County, MO R+54
- Cherokee County, OK R+28
- Adair County, OK R+54
- Washington County, AR R+3
- Cherokee County, KS R+56
Counties with Similar Populations
- Tazewell County, VA R+58
- Ottawa County, OH R+30
- Rio Arriba County, NM D+20
- McKean County, PA R+43
- LaGrange County, IN R+63
- Orleans County, NY R+32
- Pike County, MS D+8
- Amador County, CA R+35
- Fayette County, WV R+46
- Wyoming County, NY R+39
Sources and methodology
Precinct-level voting records used to fit the model come from Oklahoma State Election Board, distributed by the Voting and Election Science Team. Demographic inputs come from the U.S. Census Bureau (ACS 5-year estimates and the 2020 Decennial Census). Health and environmental inputs come from the CDC (PLACES and the Environmental Justice Index). Land cover comes from the USGS and EPA. Election-day and lead-up weather come from PRISM 4km daily grids and the NOAA Global Historical Climatology Network. Mail-voting and election-administration patterns come from the MIT Election Lab's Survey of the Performance of American Elections. Block-group crime detail comes from CrimeGrade. Internet data and modeling support provided by ISPreports.org.
Modeling and analysis by the BestNeighborhood data science team. Full methodology and findings: political spectrum map.
Methodology reviewed by the BestNeighborhood data team. Last updated May 2026.