Denbigh is a Democratic stronghold. About 77% of voters here vote Democratic and 23% Republican.
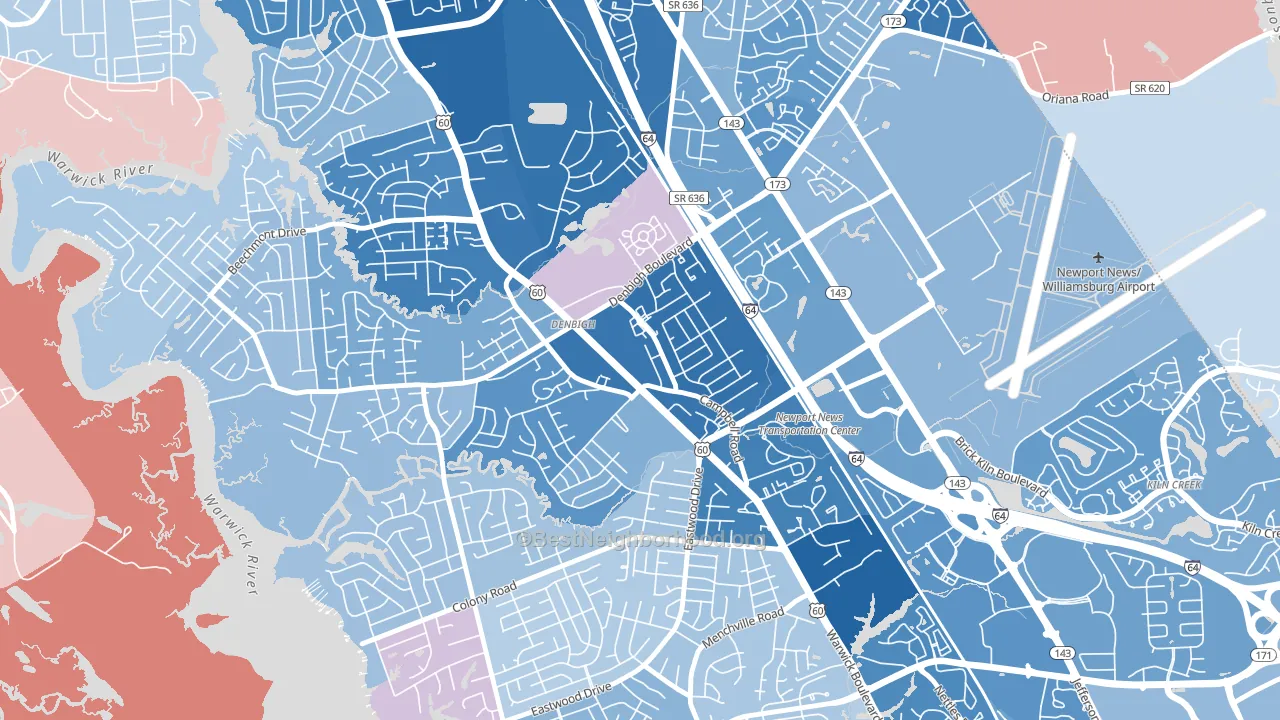
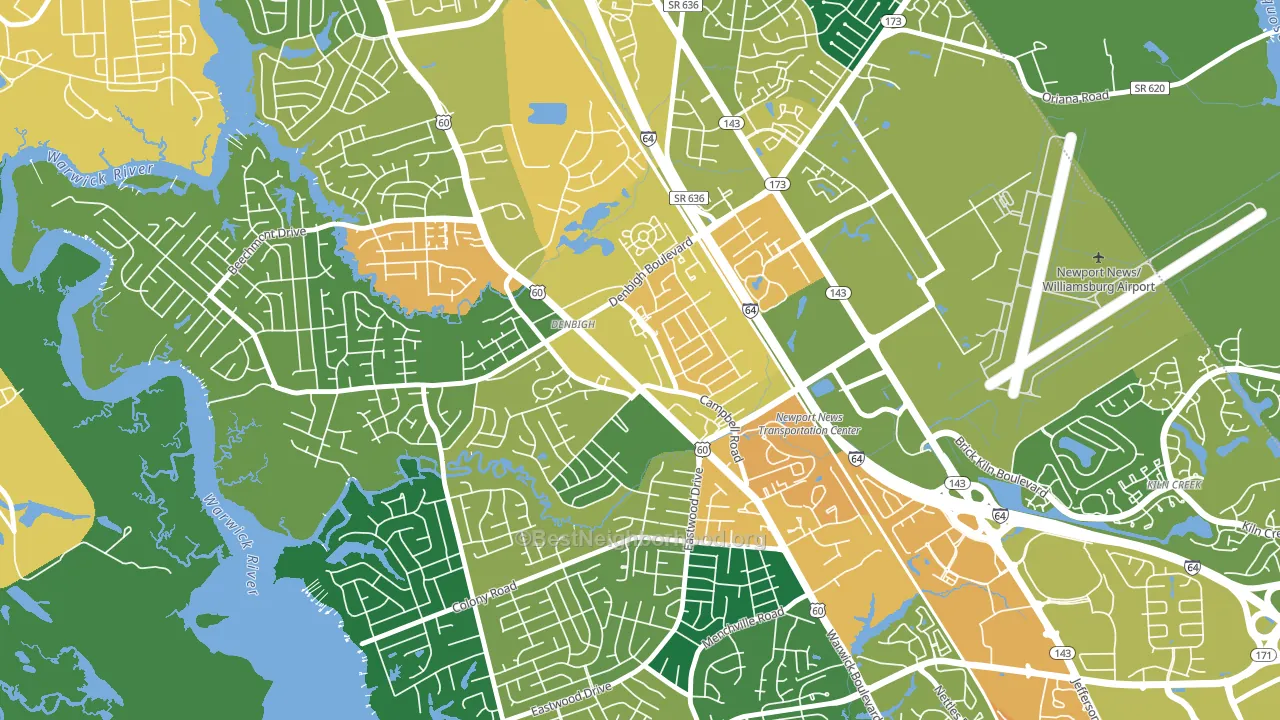
About 61% of adults in Denbigh typically vote, near the U.S. average of about 62%. Among adults in Denbigh, ~47% vote Democratic, ~14% Republican, and ~39% don't vote. The map below shows estimated turnout by block group.
How Denbigh compares
Among neighborhoods within 5 miles, Denbigh leans more Democratic than 8 of 9 neighbors.
Denbigh runs about 49 points more Democratic than Virginia as a whole.
Politics vary noticeably by block within Denbigh. The southeast side is the most Democratic-leaning (D+66) and the south side is the least Democratic-leaning (D+23), a spread of about 43 points.
Why Denbigh leans the way it does
Density, race composition, education, and family structure all sit close to their national averages in Denbigh. The lean here lands roughly where demographic data alone would predict.
Renting and voter turnout
Places with renter-heavy households tend to turn out at a lower rate; Denbigh, Newport News, VA sits in the top quarter nationally on this measure.
Why turnout in Denbigh looks the way it does
Turnout in Denbigh sits close to the national pattern. Routine healthcare access, homeownership, education, and food security all land near their national averages here. Learn more about the findings and methodology on the political spectrum map.
Nearby Neighborhoods
- Jenkins, Newport News, VA D+51
- Epes, Newport News, VA D+61
- McIntosh, Newport News, VA D+47
- Reservoir, Newport News, VA D+42
- Palmer, Newport News, VA D+32
- Lee Hall, Newport News, VA D+51
- Greenwood, Newport News, VA D+38
- Deer Park, Newport News, VA D+35
- Christopher Newport, Newport News, VA D+50
- Saunders, Newport News, VA D+22
Neighborhoods with Similar Populations
- East Durham, Durham, NC D+74
- Hamilton, Worcester, MA D+21
- North End Manchester, Manchester, NH D+29
- Core, San Diego, CA D+43
- The Woods at Mill Valley, Marysville, OH R+23
- Platt Park, Denver, CO D+67
- Lake Balboa, Van Nuys, CA D+32
- Meadowlane, Lincoln, NE D+3
- Diamond Hill-Jarvis, Fort Worth, TX D+20
- Beverly Woods, Charlotte, NC D+7
Sources and methodology
Precinct-level voting records used to fit the model come from Virginia Department of Elections, distributed by the Voting and Election Science Team. Demographic inputs come from the U.S. Census Bureau (ACS 5-year estimates and the 2020 Decennial Census). Health and environmental inputs come from the CDC (PLACES and the Environmental Justice Index). Land cover comes from the USGS and EPA. Election-day and lead-up weather come from PRISM 4km daily grids and the NOAA Global Historical Climatology Network. Mail-voting and election-administration patterns come from the MIT Election Lab's Survey of the Performance of American Elections. Block-group crime detail comes from CrimeGrade. Internet data and modeling support provided by ISPreports.org.
Modeling and analysis by the BestNeighborhood data science team. Full methodology and findings: political spectrum map.
Methodology reviewed by the BestNeighborhood data team. Last updated May 2026.