
Deer Park leans heavily Democratic by roughly 34 points: about 67% of voters vote Democratic and 33% Republican.
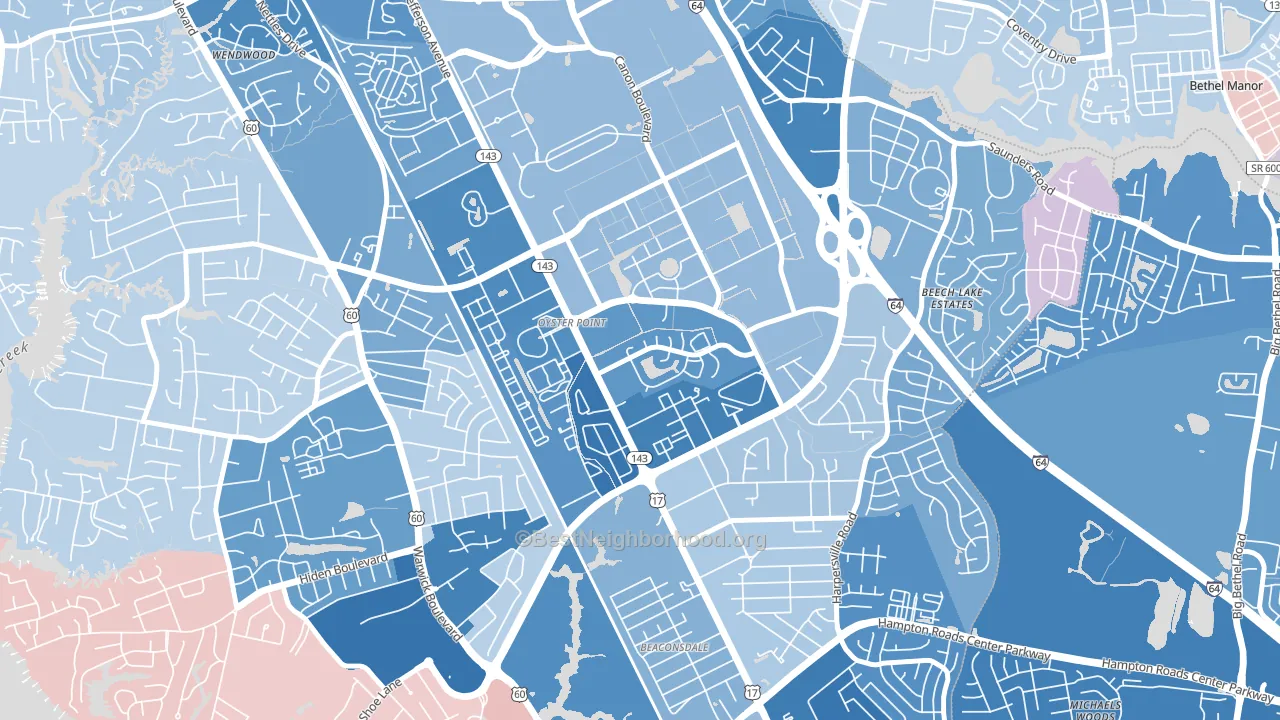
About 62% of adults in Deer Park typically vote, near the U.S. average of about 62%. Among adults in Deer Park, ~41% vote Democratic, ~21% Republican, and ~38% don't vote. The map below shows estimated turnout by block group.
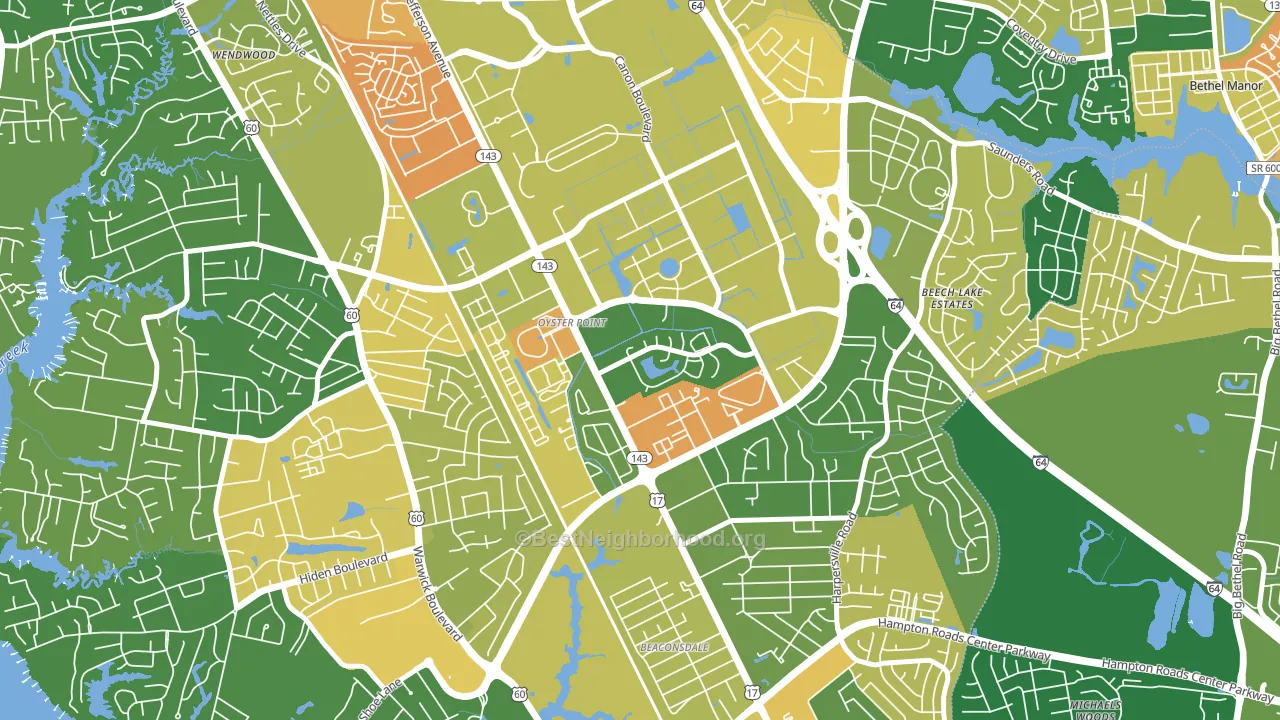
How Deer Park compares
Among neighborhoods within 5 miles, Deer Park leans more Democratic than 2 of 7 neighbors.
Deer Park runs about 29 points more Democratic than Virginia as a whole.
Politics vary noticeably by block within Deer Park. The west side is the most Democratic-leaning (D+43) and the north side is the least Democratic-leaning (D+18), a spread of about 25 points.
Why Deer Park leans the way it does
Density, race composition, education, and family structure all sit close to their national averages in Deer Park. The lean here lands roughly where demographic data alone would predict.
Population density and Democratic lean
Places with high population density tend to lean Democratic; Deer Park, Newport News, VA sits in the top quarter nationally on this measure.
Why turnout in Deer Park looks the way it does
Renters vote less often than owners. About 73% of households in Deer Park rent, about 48 points above the U.S. average of 25%. Learn more about the findings and methodology on the political spectrum map.
Nearby Neighborhoods
- Christopher Newport, Newport News, VA D+50
- Saunders, Newport News, VA D+22
- Palmer, Newport News, VA D+32
- Jenkins, Newport News, VA D+51
- Northampton, Hampton, VA D+35
- Magruder, Hampton, VA D+47
- Denbigh, Newport News, VA D+55
- Newmarket South, Newport News, VA D+59
- Epes, Newport News, VA D+61
- Mercury Central, Hampton, VA D+47
Neighborhoods with Similar Populations
- North Los Altos, Los Altos, CA D+45
- Broadway Junction, Brooklyn, NY D+65
- Mount Pleasant, Washington, DC D+83
- Idle Hour, Lexington, KY D+35
- Wakefield Park, Annandale, VA D+35
- Pinehurst, Everett, WA D+27
- Caddo Heights-South Highlands, Shreveport, LA D+31
- Woodlawn, Portland, OR D+78
- Southgate, Portland, OR D+20
- Sun City Summerlin, Las Vegas, NV D+8
Sources and methodology
Precinct-level voting records used to fit the model come from Virginia Department of Elections, distributed by the Voting and Election Science Team. Demographic inputs come from the U.S. Census Bureau (ACS 5-year estimates and the 2020 Decennial Census). Health and environmental inputs come from the CDC (PLACES and the Environmental Justice Index). Land cover comes from the USGS and EPA. Election-day and lead-up weather come from PRISM 4km daily grids and the NOAA Global Historical Climatology Network. Mail-voting and election-administration patterns come from the MIT Election Lab's Survey of the Performance of American Elections. Block-group crime detail comes from CrimeGrade. Internet data and modeling support provided by ISPreports.org.
Modeling and analysis by the BestNeighborhood data science team. Full methodology and findings: political spectrum map.
Methodology reviewed by the BestNeighborhood data team. Last updated May 2026.