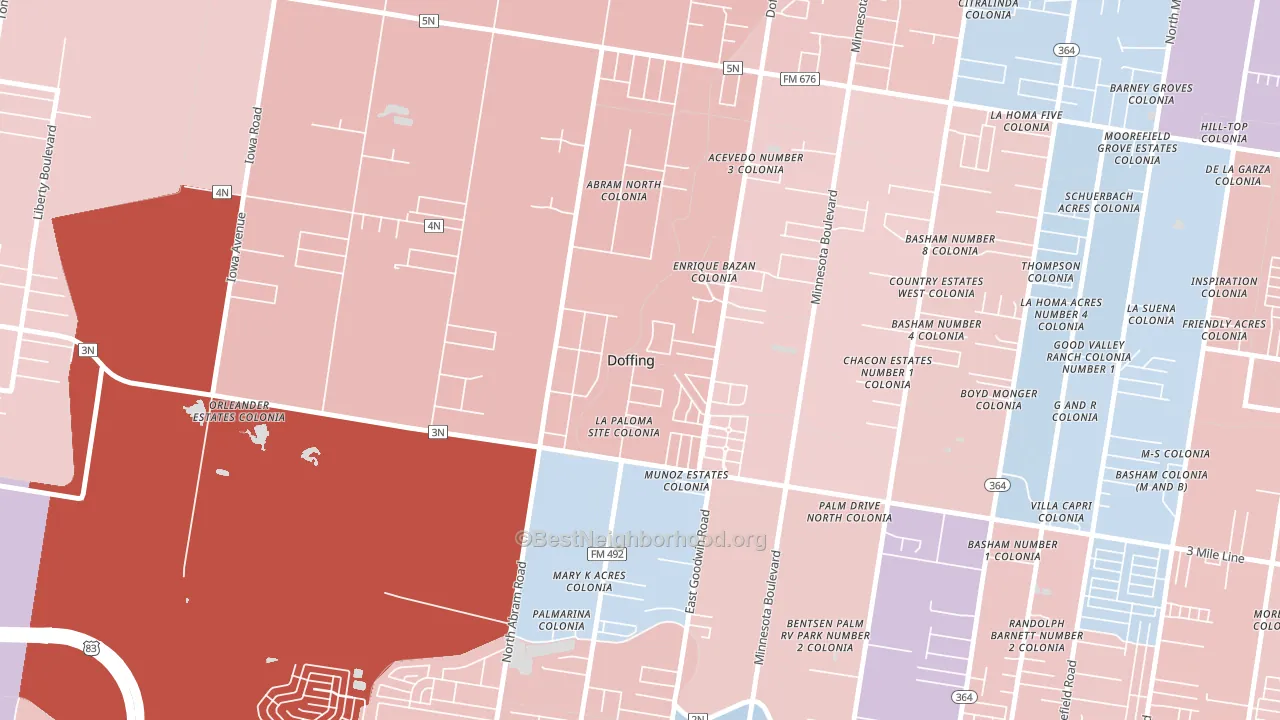
Doffing leans slightly Republican by roughly 6 points: about 47% of voters vote Democratic and 53% Republican.
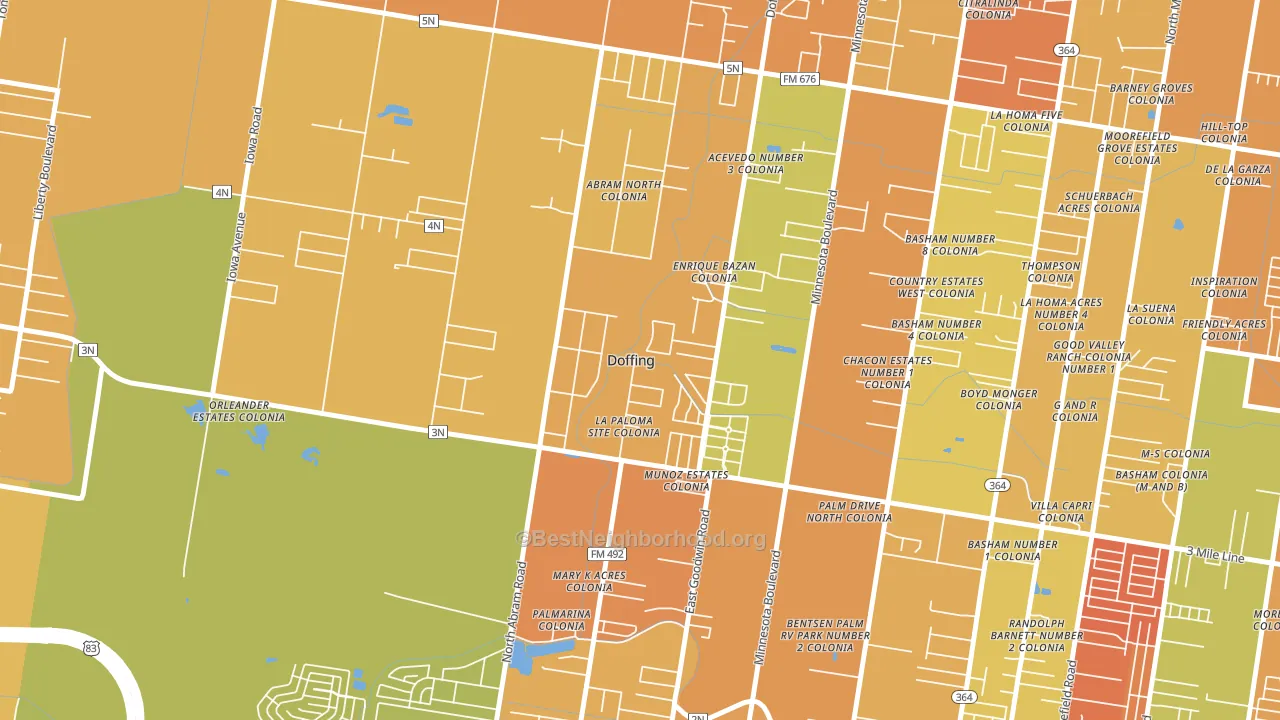
About 42% of adults in Doffing typically vote, below the U.S. average of about 62%. Among adults in Doffing, ~20% vote Democratic, ~22% Republican, and ~58% don't vote. The map below shows estimated turnout by block group.
How Doffing compares
Among neighborhoods within 5 miles, Doffing leans more Republican than 2 of 3 neighbors.
Doffing runs about 9 points more Democratic than Texas as a whole.
Why Doffing leans the way it does
This analysis examined 14,881 data points per neighborhood to find what predicts political lean and turnout. The items below are a few correlations that stood out for Doffing, not a ranked or complete list of what matters most.
Rural areas vote Republican, and Doffing sits in the bottom quarter on developed land relative to similar places. Low college attainment predicts Republican voting, and Doffing sits in the bottom quarter (about 13%, below 89% of neighborhoods). A high family-household share predicts Republican voting, and about 94% of households in Doffing are family households, in the top fraction of neighborhoods.
Walkability and Republican lean
Places with a low walkability score tend to lean Republican; Doffing, Mission, TX sits in the bottom tenth nationally on this measure. A walkable street grid does not change how people vote; it mostly reflects how urban a place is.
Why turnout in Doffing looks the way it does
Areas with limited routine healthcare access turn out at lower rates. Doffing is in the bottom quarter nationally for routine-care measures such as insurance coverage, preventive screenings, and dental visits. The dental-visit rate here is about 32%, about 22 points below the Texas average of 54%. Low high-school completion lines up with lower turnout, and about 47% of adults in Doffing have completed high school, in the bottom fraction of neighborhoods. High-crime urban areas turn out at lower rates, and Doffing sits in the top 15% on a violent-crime measure. Learn more about the findings and methodology on the political spectrum map.
Nearby Neighborhoods
- La Homa, Mission, TX R+4
- West Sharyland, Mission, TX R+3
- Abram-Perezville, Mission, TX R+6
- Sharyland Plantation, Mission, TX R+6
- College Heights, McAllen, TX D+14
- Enfield Estates, Edinburg, TX R+2
- Downtown Brownsville, Brownsville, TX D+15
- Medina, Zapata, TX Even
- Santa Fe, Laredo, TX R+8
- Santo Nino, Laredo, TX D+7
Neighborhoods with Similar Populations
- College Creek, Ames, IA D+25
- Parkmont, Fremont, CA D+36
- Meadow Park, Rochester, MN D+13
- Overbrook, Pittsburgh, PA D+4
- Overlook Park, Allentown, PA D+26
- Pearl-Meigs-Monroe, Rochester, NY D+61
- Marlborough Heights-Marlborough Pride, Kansas City, MO D+67
- West del Paso Heights, Sacramento, CA D+31
- West Downtown Dearborn, Dearborn, MI D+8
- Arena District, San Antonio, TX D+44
Sources and methodology
Precinct-level voting records used to fit the model come from Texas Secretary of State, Elections Division, distributed by the Voting and Election Science Team. Demographic inputs come from the U.S. Census Bureau (ACS 5-year estimates and the 2020 Decennial Census). Health and environmental inputs come from the CDC (PLACES and the Environmental Justice Index). Land cover comes from the USGS and EPA. Election-day and lead-up weather come from PRISM 4km daily grids and the NOAA Global Historical Climatology Network. Mail-voting and election-administration patterns come from the MIT Election Lab's Survey of the Performance of American Elections. Block-group crime detail comes from CrimeGrade. Internet data and modeling support provided by ISPreports.org.
Modeling and analysis by the BestNeighborhood data science team. Full methodology and findings: political spectrum map.
Methodology reviewed by the BestNeighborhood data team. Last updated May 2026.