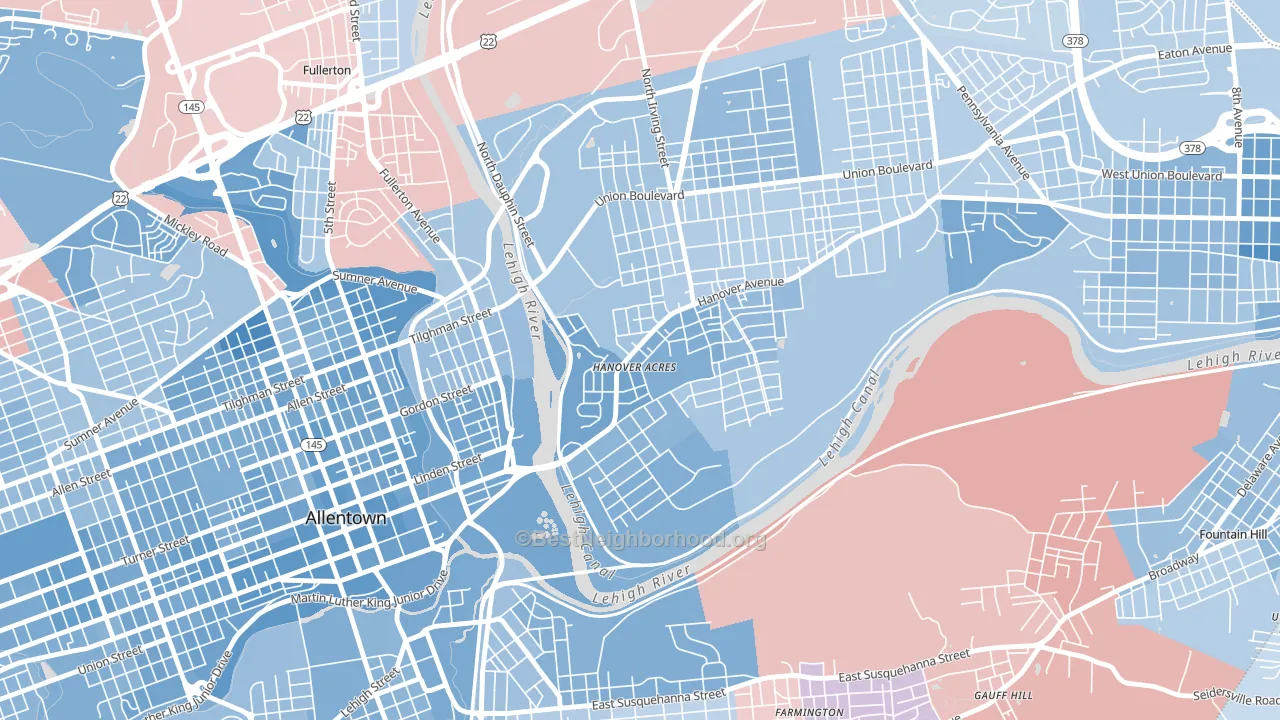
Overlook Park leans Democratic by roughly 26 points: about 63% of voters vote Democratic and 37% Republican.
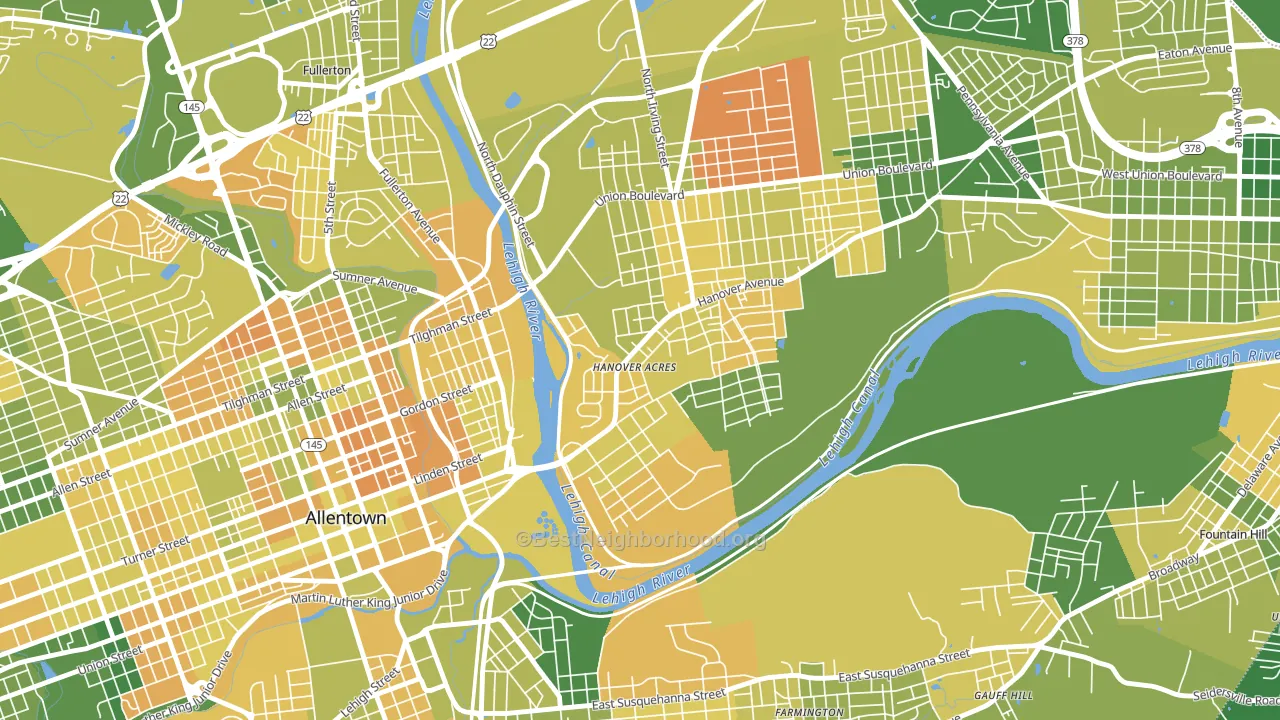
About 56% of adults in Overlook Park typically vote, below the U.S. average of about 62%. Among adults in Overlook Park, ~35% vote Democratic, ~21% Republican, and ~44% don't vote. The map below shows estimated turnout by block group.
How Overlook Park compares
Among neighborhoods within 5 miles, Overlook Park leans more Democratic than 9 of 18 neighbors.
Overlook Park runs about 28 points more Democratic than Pennsylvania as a whole. Pennsylvania is roughly evenly split, and Overlook Park sits clearly on the Democratic side.
Politics vary noticeably by block within Overlook Park. The southwest side is the most Democratic-leaning (D+33) and the northeast side is the least Democratic-leaning (D+7), a spread of about 26 points.
Why Overlook Park leans the way it does
This analysis examined 14,881 data points per neighborhood to find what predicts political lean and turnout. The items below are a few correlations that stood out for Overlook Park, not a ranked or complete list of what matters most.
Overlook Park votes against the grain of Pennsylvania. Pennsylvania is roughly evenly split, while Overlook Park runs about 28 points more Democratic. A high never-married share predicts Democratic voting, and about 51% of adults in Overlook Park have never been married, above 83% of neighborhoods.
Population density and Democratic lean
Places with high population density tend to lean Democratic; Overlook Park, Allentown, PA sits in the top quarter nationally on this measure.
Why turnout in Overlook Park looks the way it does
Areas with low high-school completion turn out at lower rates. About 77% of adults in Overlook Park have completed high school, about 13 points below the U.S. average of 90%. Learn more about the findings and methodology on the political spectrum map.
Nearby Neighborhoods
- 1st Ward, Allentown, PA D+30
- 6th Ward, Allentown, PA D+14
- Rittersville, Allentown, PA D+10
- Jordan Heights, Allentown, PA D+36
- NoTi, Allentown, PA D+30
- Downtown, Allentown, PA D+38
- Old Allentown, Allentown, PA D+34
- Eighth Ward, Allentown, PA D+26
- Fairview, Allentown, PA D+23
- West Park, Allentown, PA D+29
Neighborhoods with Similar Populations
- Overbrook, Pittsburgh, PA D+4
- Pearl-Meigs-Monroe, Rochester, NY D+61
- Parkmont, Fremont, CA D+36
- West del Paso Heights, Sacramento, CA D+31
- Meadow Park, Rochester, MN D+13
- Marlborough Heights-Marlborough Pride, Kansas City, MO D+67
- College Creek, Ames, IA D+25
- Doffing, Mission, TX R+5
- West Downtown Dearborn, Dearborn, MI D+8
- Arena District, San Antonio, TX D+44
Sources and methodology
Precinct-level voting records used to fit the model come from Pennsylvania Department of State, Bureau of Elections, distributed by the Voting and Election Science Team. Demographic inputs come from the U.S. Census Bureau (ACS 5-year estimates and the 2020 Decennial Census). Health and environmental inputs come from the CDC (PLACES and the Environmental Justice Index). Land cover comes from the USGS and EPA. Election-day and lead-up weather come from PRISM 4km daily grids and the NOAA Global Historical Climatology Network. Mail-voting and election-administration patterns come from the MIT Election Lab's Survey of the Performance of American Elections. Block-group crime detail comes from CrimeGrade. Internet data and modeling support provided by ISPreports.org.
Modeling and analysis by the BestNeighborhood data science team. Full methodology and findings: political spectrum map.
Methodology reviewed by the BestNeighborhood data team. Last updated May 2026.