College Creek leans Democratic by roughly 24 points: about 62% of voters vote Democratic and 38% Republican.
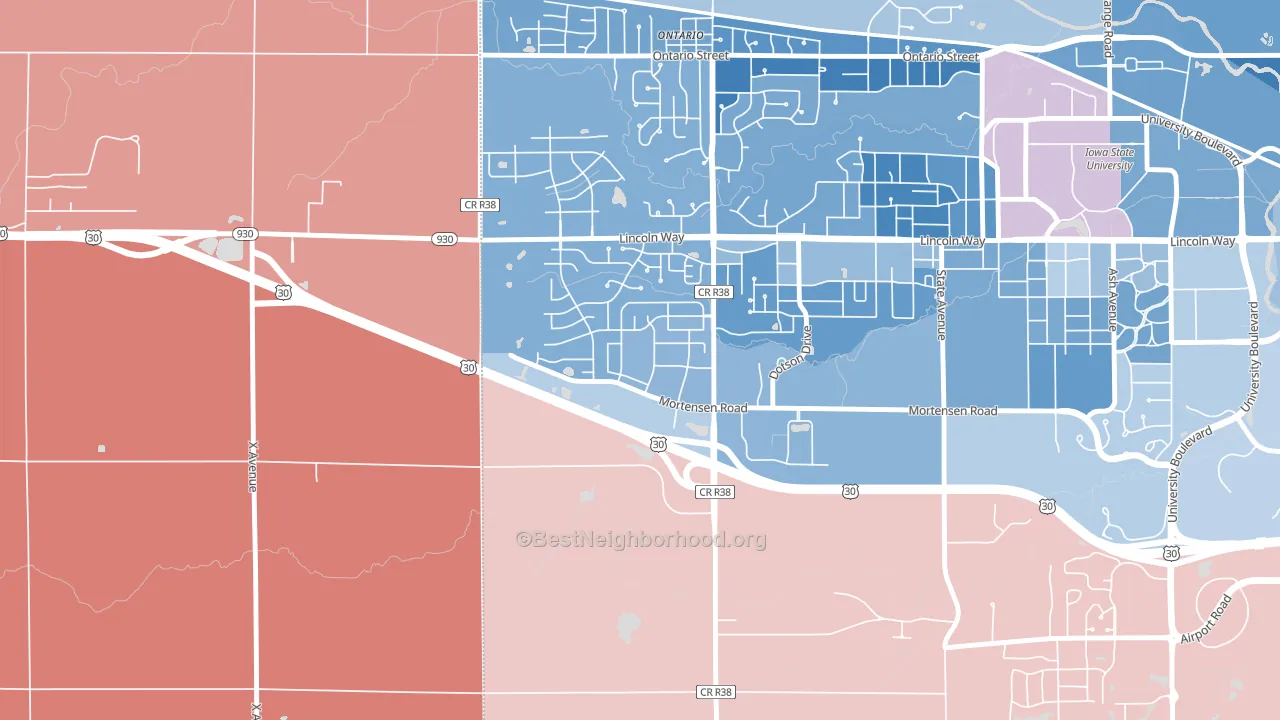
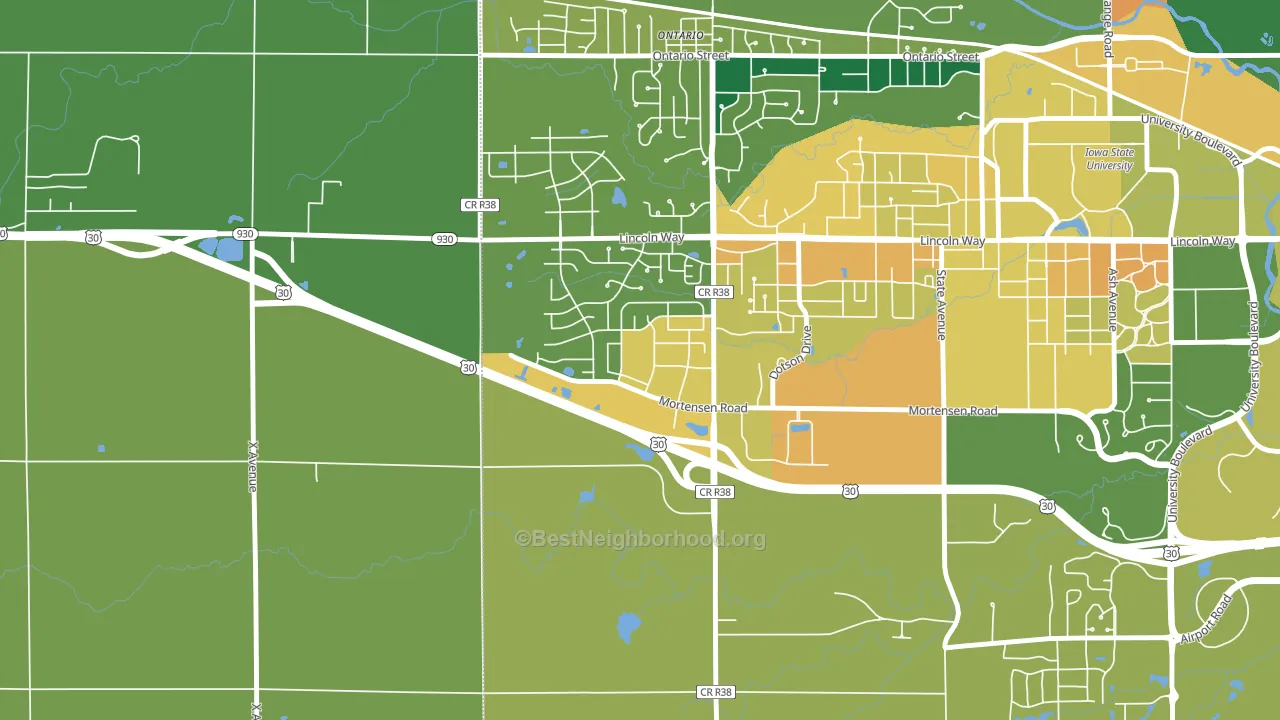
About 62% of adults in College Creek typically vote, near the U.S. average of about 62%. Among adults in College Creek, ~38% vote Democratic, ~24% Republican, and ~38% don't vote. The map below shows estimated turnout by block group.
How College Creek compares
College Creek sits in a sparsely populated area with few comparable neighborhoods nearby.
College Creek runs about 38 points more Democratic than Iowa as a whole. Iowa leans Republican overall, while College Creek is one of the few Democratic-leaning pockets.
Why College Creek leans the way it does
This analysis examined 14,881 data points per neighborhood to find what predicts political lean and turnout. The items below are a few correlations that stood out for College Creek, not a ranked or complete list of what matters most.
Areas with many never-married adults vote Democratic. About 65% of adults in College Creek have never been married, well above similar-sized neighborhoods (around 46%). College Creek runs against the grain of Iowa, a Democratic-leaning pocket in a Republican-leaning state.
Paved land cover and Democratic lean
Places with extensive paved surfaces tend to lean Democratic; College Creek, Ames, IA sits above the national average on this measure. Paved ground does not change how people vote; it mostly reflects how urban and built-up a place is.
Why turnout in College Creek looks the way it does
Areas with high high-school completion turn out at higher rates. About 98% of adults in College Creek have completed high school, about 9 points above the U.S. average of 90%. Learn more about the findings and methodology on the political spectrum map.
Nearby Neighborhoods
- Crawford, Ames, IA D+26
- Iowa State University, Ames, IA D+22
- Meredith, Des Moines, IA D+17
- Lower Beaver, Des Moines, IA D+23
- Oak Park, Des Moines, IA D+27
- Highland Park, Des Moines, IA D+19
- Douglas Acres, Des Moines, IA D+4
- Merle Hay, Des Moines, IA D+24
- Beaverdale, Des Moines, IA D+39
- Union Park, Des Moines, IA D+15
Neighborhoods with Similar Populations
- Doffing, Mission, TX R+5
- Meadow Park, Rochester, MN D+13
- Parkmont, Fremont, CA D+36
- Pearl-Meigs-Monroe, Rochester, NY D+61
- Overlook Park, Allentown, PA D+26
- Overbrook, Pittsburgh, PA D+4
- Marlborough Heights-Marlborough Pride, Kansas City, MO D+67
- West del Paso Heights, Sacramento, CA D+31
- West Downtown Dearborn, Dearborn, MI D+8
- Arena District, San Antonio, TX D+44
Sources and methodology
Precinct-level voting records used to fit the model come from Iowa Secretary of State, Elections, distributed by the Voting and Election Science Team. Demographic inputs come from the U.S. Census Bureau (ACS 5-year estimates and the 2020 Decennial Census). Health and environmental inputs come from the CDC (PLACES and the Environmental Justice Index). Land cover comes from the USGS and EPA. Election-day and lead-up weather come from PRISM 4km daily grids and the NOAA Global Historical Climatology Network. Mail-voting and election-administration patterns come from the MIT Election Lab's Survey of the Performance of American Elections. Block-group crime detail comes from CrimeGrade. Internet data and modeling support provided by ISPreports.org.
Modeling and analysis by the BestNeighborhood data science team. Full methodology and findings: political spectrum map.
Methodology reviewed by the BestNeighborhood data team. Last updated May 2026.