Dogwood Hollow is a true toss-up. About 48% of voters here vote Democratic and 52% Republican.
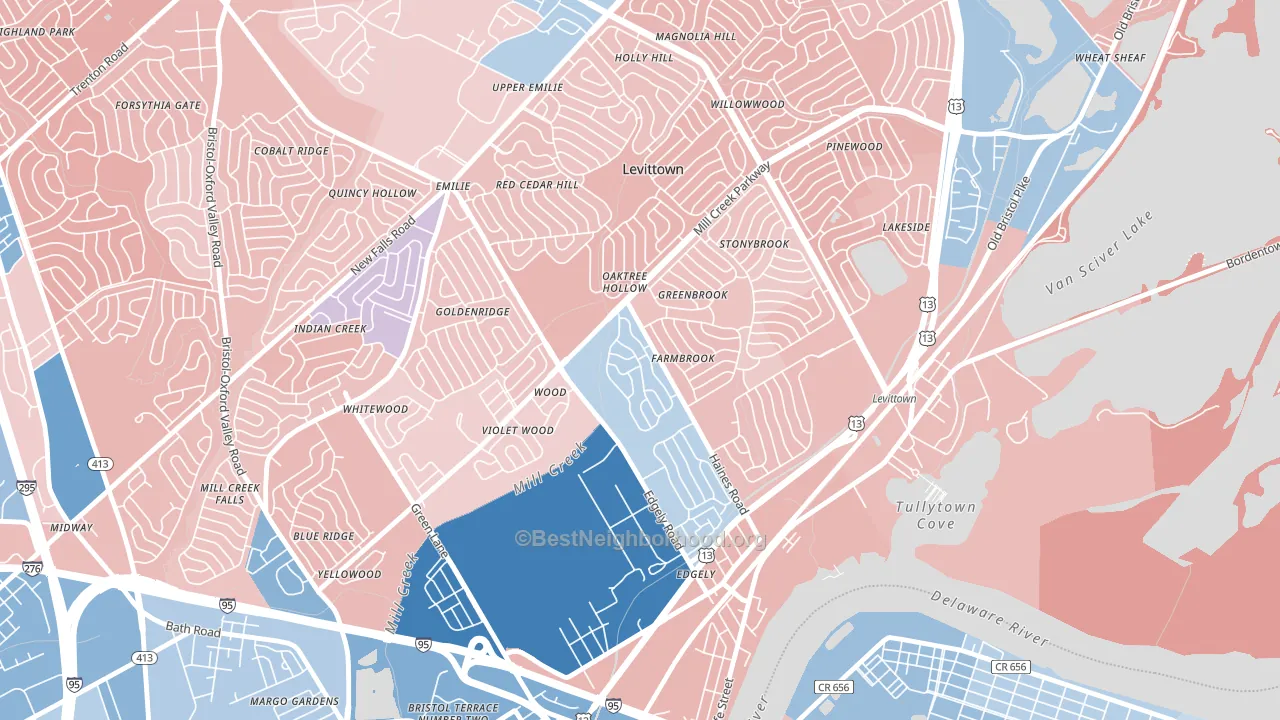
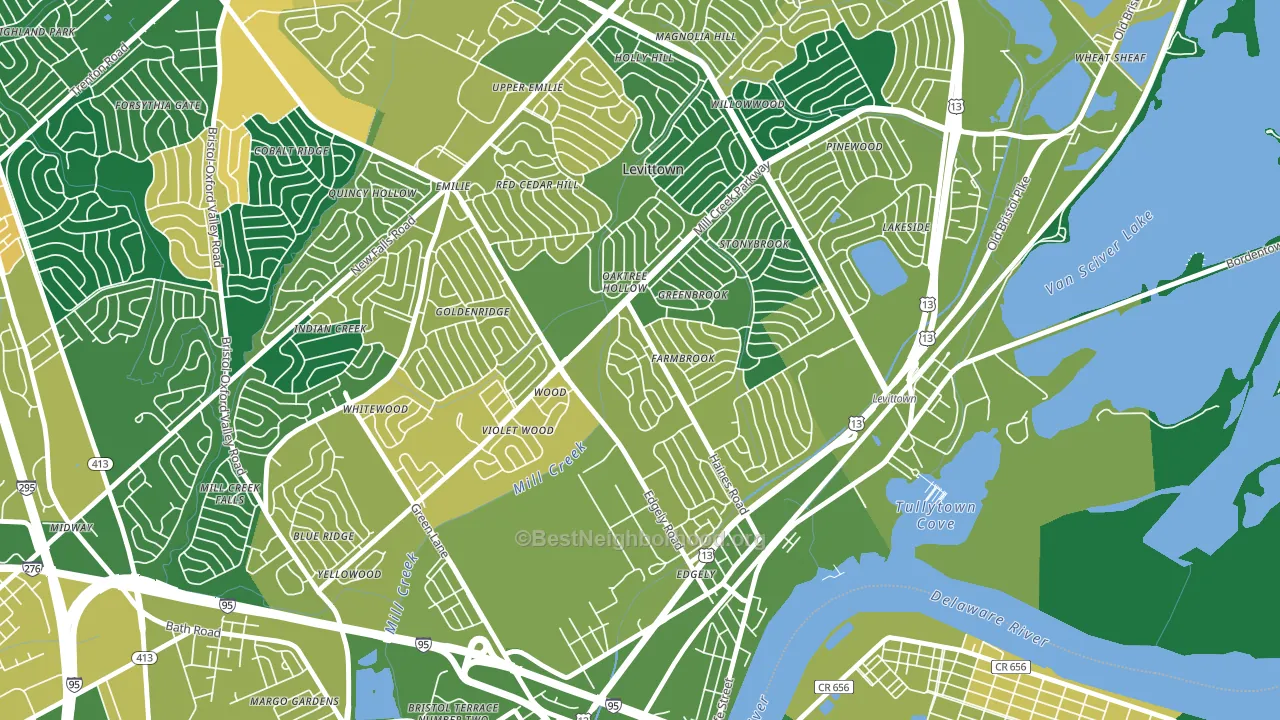
About 71% of adults in Dogwood Hollow typically vote, above the U.S. average of about 62%. Among adults in Dogwood Hollow, ~34% vote Democratic, ~37% Republican, and ~29% don't vote. The map below shows estimated turnout by block group.
How Dogwood Hollow compares
Politically, Dogwood Hollow sits close to the rest of Pennsylvania.
Politics vary noticeably by block within Dogwood Hollow. The south side runs the most Democratic (D+3) and the north side runs the most Republican (R+11), a spread of about 14 points.
Why Dogwood Hollow leans the way it does
Density, race composition, education, and family structure all sit close to their national averages in Dogwood Hollow. The lean here lands roughly where demographic data alone would predict.
Walkability and Republican lean
Places with a low walkability score tend to lean Republican; Dogwood Hollow, Levittown, PA sits below the national average on this measure. A walkable street grid does not change how people vote; it mostly reflects how urban a place is.
Why turnout in Dogwood Hollow looks the way it does
Turnout in Dogwood Hollow sits close to the national pattern. Routine healthcare access, homeownership, education, and food security all land near their national averages here. Learn more about the findings and methodology on the political spectrum map.
Nearby Neighborhoods
- Neshaminy Valley, Bensalem, PA Even
- South Trenton, Trenton, NJ D+45
- Chestnut Park, Trenton, NJ D+42
- Downtown Trenton, Trenton, NJ D+76
- Franklin Park, Trenton, NJ D+34
- Central West, Trenton, NJ D+79
- Chambersburg, Trenton, NJ D+39
- Stanwood, Bensalem, PA D+14
- Greenwood and Hamilton, Trenton, NJ D+64
- Somerset Park, Willingboro, NJ D+65
Neighborhoods with Similar Populations
- Moorings-Coquina Sands, Naples, FL R+21
- Briarcreek-Woodland, Charlotte, NC D+49
- Mount Pleasant, Chicago, IL D+28
- Ellwanger-Barry, Rochester, NY D+68
- Thurston Woods, Milwaukee, WI D+79
- Far North Dallas-Carrollton, Carrollton, TX D+11
- Near Eastside, Syracuse, NY D+69
- West Village, Cuyahoga Falls, OH D+6
- Tevis Ranch, Bakersfield, CA R+17
- Westwood Richland, Abilene, TX R+18
Sources and methodology
Precinct-level voting records used to fit the model come from Pennsylvania Department of State, Bureau of Elections, distributed by the Voting and Election Science Team. Demographic inputs come from the U.S. Census Bureau (ACS 5-year estimates and the 2020 Decennial Census). Health and environmental inputs come from the CDC (PLACES and the Environmental Justice Index). Land cover comes from the USGS and EPA. Election-day and lead-up weather come from PRISM 4km daily grids and the NOAA Global Historical Climatology Network. Mail-voting and election-administration patterns come from the MIT Election Lab's Survey of the Performance of American Elections. Block-group crime detail comes from CrimeGrade. Internet data and modeling support provided by ISPreports.org.
Modeling and analysis by the BestNeighborhood data science team. Full methodology and findings: political spectrum map.
Methodology reviewed by the BestNeighborhood data team. Last updated May 2026.