Tevis Ranch leans Republican by roughly 18 points: about 41% of voters vote Democratic and 59% Republican.
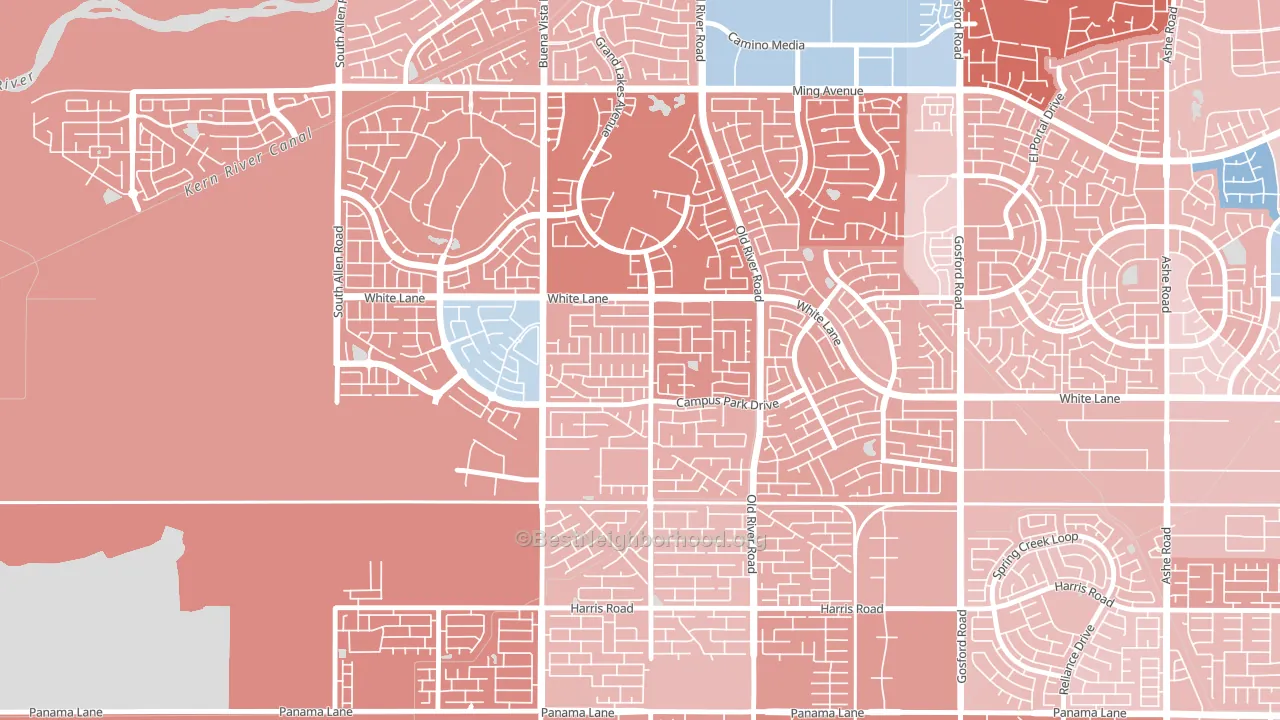
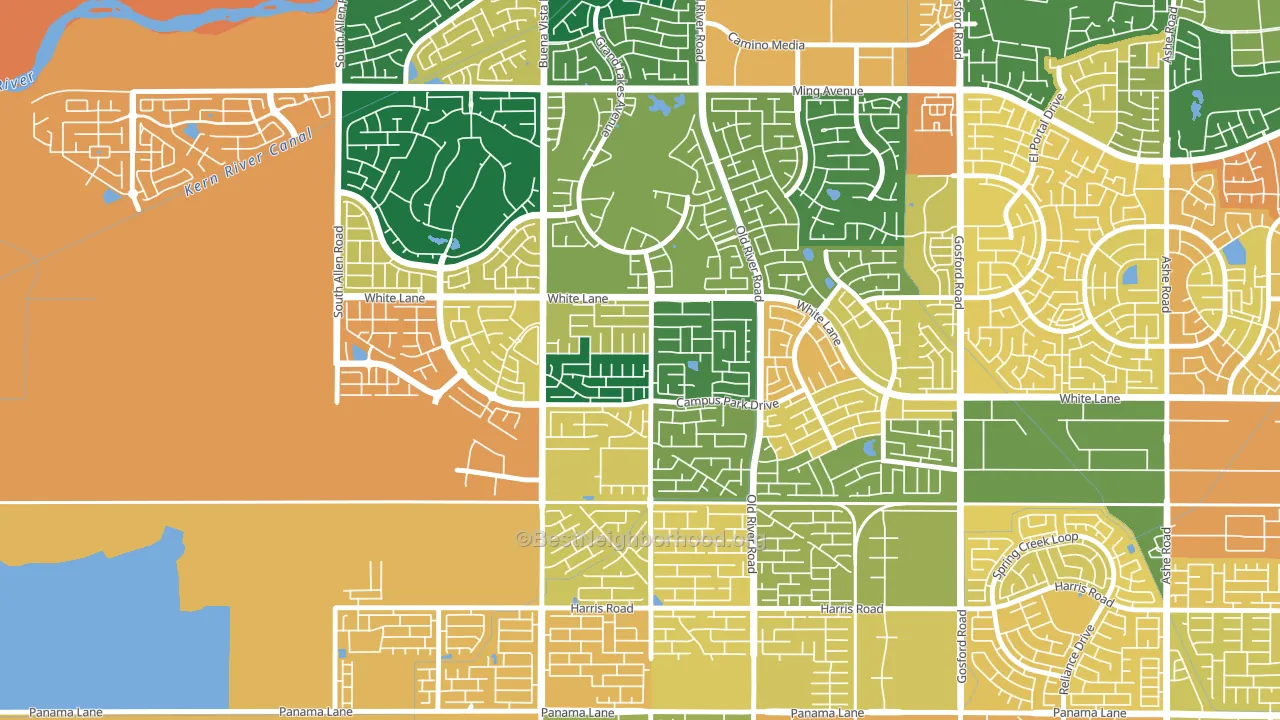
About 75% of adults in Tevis Ranch typically vote, above the U.S. average of about 62%. Among adults in Tevis Ranch, ~31% vote Democratic, ~44% Republican, and ~25% don't vote. The map below shows estimated turnout by block group.
How Tevis Ranch compares
Among neighborhoods within 5 miles, Tevis Ranch leans more Republican than 11 of 16 neighbors.
Tevis Ranch runs about 37 points more Republican than California as a whole. California leans Democratic overall, while Tevis Ranch is one of the few Republican-leaning pockets.
Why Tevis Ranch leans the way it does
This analysis examined 14,881 data points per neighborhood to find what predicts political lean and turnout. The items below are a few correlations that stood out for Tevis Ranch, not a ranked or complete list of what matters most.
Tevis Ranch votes Republican even though it is densely developed (more than 99%, far above the California average of 58%). State and regional patterns outweigh the Democratic lean that density usually predicts here. A high family-household share predicts Republican voting, and about 83% of households in Tevis Ranch are family households, above 90% of neighborhoods. Tevis Ranch runs against the grain of California, a Republican-leaning pocket in a Democratic-leaning state.
Walkability and Republican lean
Places with a low walkability score tend to lean Republican; Tevis Ranch, Bakersfield, CA sits in the bottom quarter nationally on this measure. A walkable street grid does not change how people vote; it mostly reflects how urban a place is.
Why turnout in Tevis Ranch looks the way it does
Areas with strong routine healthcare access turn out at higher rates. Tevis Ranch is in the top quarter nationally for routine-care measures such as insurance coverage, preventive screenings, and dental visits. The dental-visit rate here is about 71%, about 11 points above the U.S. average of 60%. Learn more about the findings and methodology on the political spectrum map.
Nearby Neighborhoods
- Terra Vista, Bakersfield, CA R+7
- The Oaks, Bakersfield, CA R+22
- Seven Oaks, Bakersfield, CA R+28
- Seven Oaks at Grand Island, Bakersfield, CA R+22
- Artisan, Bakersfield, CA R+6
- Haggin Oaks, Bakersfield, CA R+19
- Laurelglen, Bakersfield, CA R+15
- Silver Creek, Bakersfield, CA R+5
- Spice Tract, Bakersfield, CA Even
- Sagepointe, Bakersfield, CA D+8
Neighborhoods with Similar Populations
- Glenwood Meadows, Sacramento, CA D+26
- Near Eastside, Syracuse, NY D+69
- Far North Dallas-Carrollton, Carrollton, TX D+11
- Cedonia, Baltimore, MD D+84
- Thurston Woods, Milwaukee, WI D+79
- Chandler Heights, Garland, TX D+14
- Briarcreek-Woodland, Charlotte, NC D+49
- Centretech, Aurora, CO D+34
- Ginter Park, Richmond, VA D+72
- River Oaks, Memphis, TN D+15
Sources and methodology
Precinct-level voting records used to fit the model come from California Secretary of State, Elections, distributed by the Voting and Election Science Team. Demographic inputs come from the U.S. Census Bureau (ACS 5-year estimates and the 2020 Decennial Census). Health and environmental inputs come from the CDC (PLACES and the Environmental Justice Index). Land cover comes from the USGS and EPA. Election-day and lead-up weather come from PRISM 4km daily grids and the NOAA Global Historical Climatology Network. Mail-voting and election-administration patterns come from the MIT Election Lab's Survey of the Performance of American Elections. Block-group crime detail comes from CrimeGrade. Internet data and modeling support provided by ISPreports.org.
Modeling and analysis by the BestNeighborhood data science team. Full methodology and findings: political spectrum map.
Methodology reviewed by the BestNeighborhood data team. Last updated May 2026.