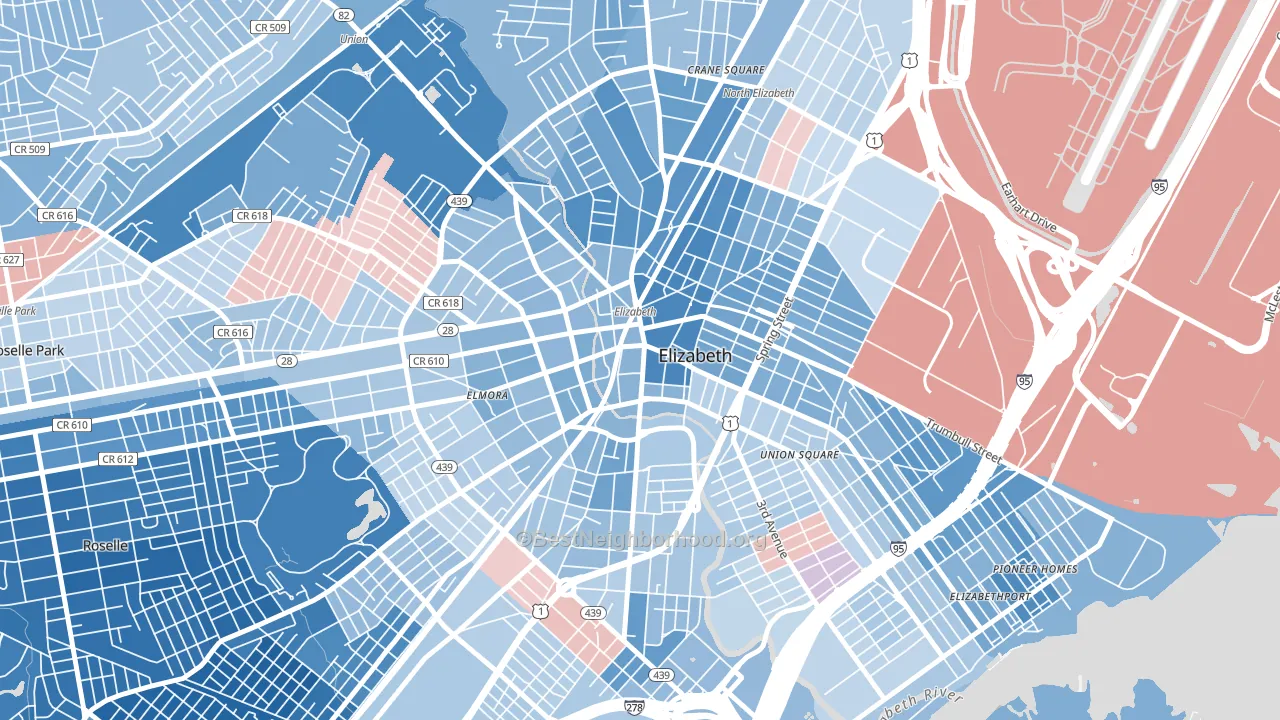
Downtown Elizabeth leans Democratic by roughly 28 points: about 64% of voters vote Democratic and 36% Republican.
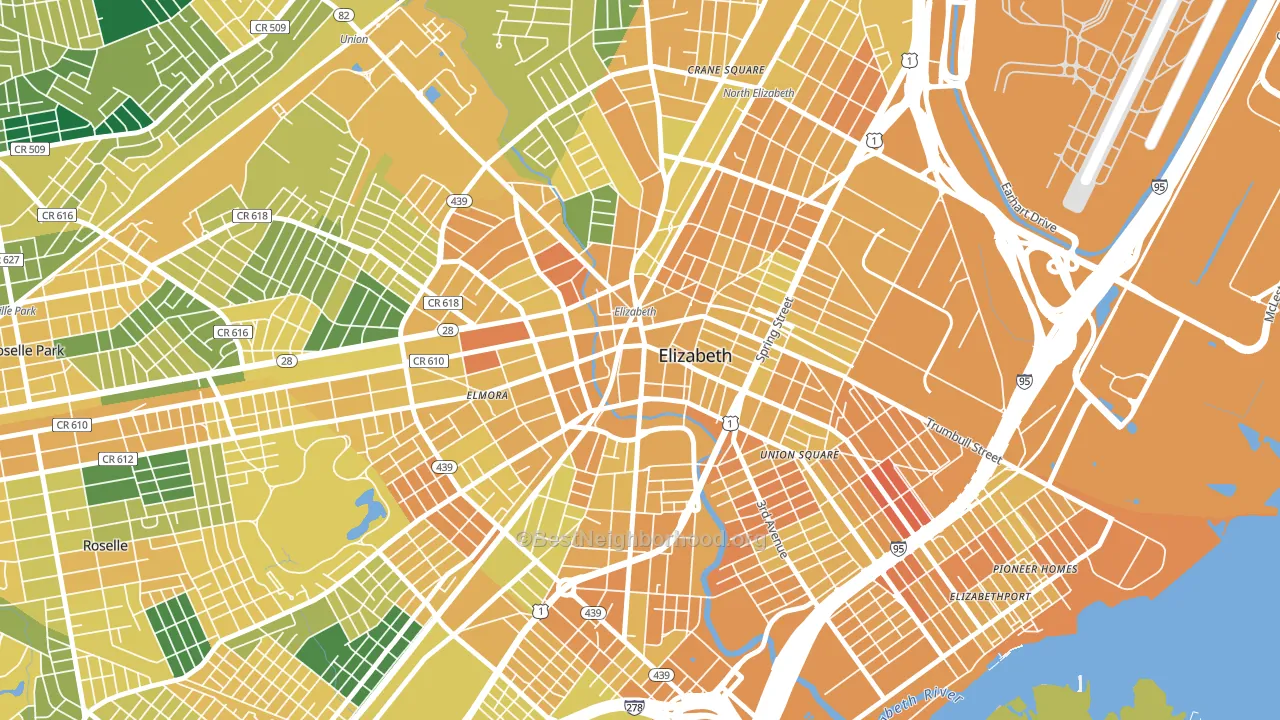
About 36% of adults in Downtown Elizabeth typically vote, below the U.S. average of about 62%. Among adults in Downtown Elizabeth, ~23% vote Democratic, ~13% Republican, and ~64% don't vote. The map below shows estimated turnout by block group.
How Downtown Elizabeth compares
Among neighborhoods within 5 miles, Downtown Elizabeth leans more Democratic than 5 of 11 neighbors.
Downtown Elizabeth runs about 22 points more Democratic than New Jersey as a whole.
Politics vary noticeably by block within Downtown Elizabeth. The northeast side is the most Democratic-leaning (D+39) and the southeast side is the least Democratic-leaning (D+12), a spread of about 27 points.
Why Downtown Elizabeth leans the way it does
This analysis examined 14,881 data points per neighborhood to find what predicts political lean and turnout. The items below are a few correlations that stood out for Downtown Elizabeth, not a ranked or complete list of what matters most.
Dense areas vote Democratic. More than 99% of residents in Downtown Elizabeth live in densely developed areas, about 64 points above the U.S. average of 36%.
Preventive-care access and voter turnout
Places with limited routine preventive-care access tend to turn out at a lower rate; Downtown Elizabeth, Elizabeth, NJ sits in the bottom quarter nationally on this measure. Dental visits do not drive turnout; the rate reflects income, insurance, and healthcare access, which line up with who votes.
Why turnout in Downtown Elizabeth looks the way it does
Areas with limited routine healthcare access turn out at lower rates. Downtown Elizabeth is in the bottom quarter nationally for routine-care measures such as insurance coverage, preventive screenings, and dental visits. The uninsured rate here is about 28%, about 18 points above the New Jersey average of 10%. Renters vote less often than owners, and about 82% of households in Downtown Elizabeth rent, compared to around 62% in nearby neighborhoods. High food insecurity lines up with lower turnout, and about 33% of adults in Downtown Elizabeth report food insecurity, above 86% of neighborhoods. Learn more about the findings and methodology on the political spectrum map.
Nearby Neighborhoods
- Howland Hook, Staten Island, NY D+58
- Weequahic, Newark, NJ D+81
- Lower Clinton Hill, Newark, NJ D+79
- Mariners Harbor, Staten Island, NY D+24
- Upper Clinton Hill, Newark, NJ D+80
- South Broad Street, Newark, NJ D+63
- South Ironbound, Newark, NJ D+25
- Port Richmond, Staten Island, NY D+24
- Constable Hook, Bayonne, NJ D+6
- Bulls Head, Staten Island, NY R+31
Neighborhoods with Similar Populations
- Merle Hay, Des Moines, IA D+24
- College Glen, Sacramento, CA D+31
- Rose Park, Salt Lake City, UT D+30
- East Raleigh, Raleigh, NC D+64
- Riverside, Baltimore, MD D+64
- Lincoln Village, Milwaukee, WI D+42
- Indiana University, Bloomington, IN D+60
- Annandale-on-Hudson, Staten Island, NY R+55
- Lakeview-Bakersfield, Bakersfield, CA D+25
- Corbett-Terwilliger-Lair Hill, Portland, OR D+68
Sources and methodology
Precinct-level voting records used to fit the model come from New Jersey Division of Elections, distributed by the Voting and Election Science Team. Demographic inputs come from the U.S. Census Bureau (ACS 5-year estimates and the 2020 Decennial Census). Health and environmental inputs come from the CDC (PLACES and the Environmental Justice Index). Land cover comes from the USGS and EPA. Election-day and lead-up weather come from PRISM 4km daily grids and the NOAA Global Historical Climatology Network. Mail-voting and election-administration patterns come from the MIT Election Lab's Survey of the Performance of American Elections. Block-group crime detail comes from CrimeGrade. Internet data and modeling support provided by ISPreports.org.
Modeling and analysis by the BestNeighborhood data science team. Full methodology and findings: political spectrum map.
Methodology reviewed by the BestNeighborhood data team. Last updated May 2026.