Indiana University is a Democratic stronghold. About 80% of voters here vote Democratic and 20% Republican.
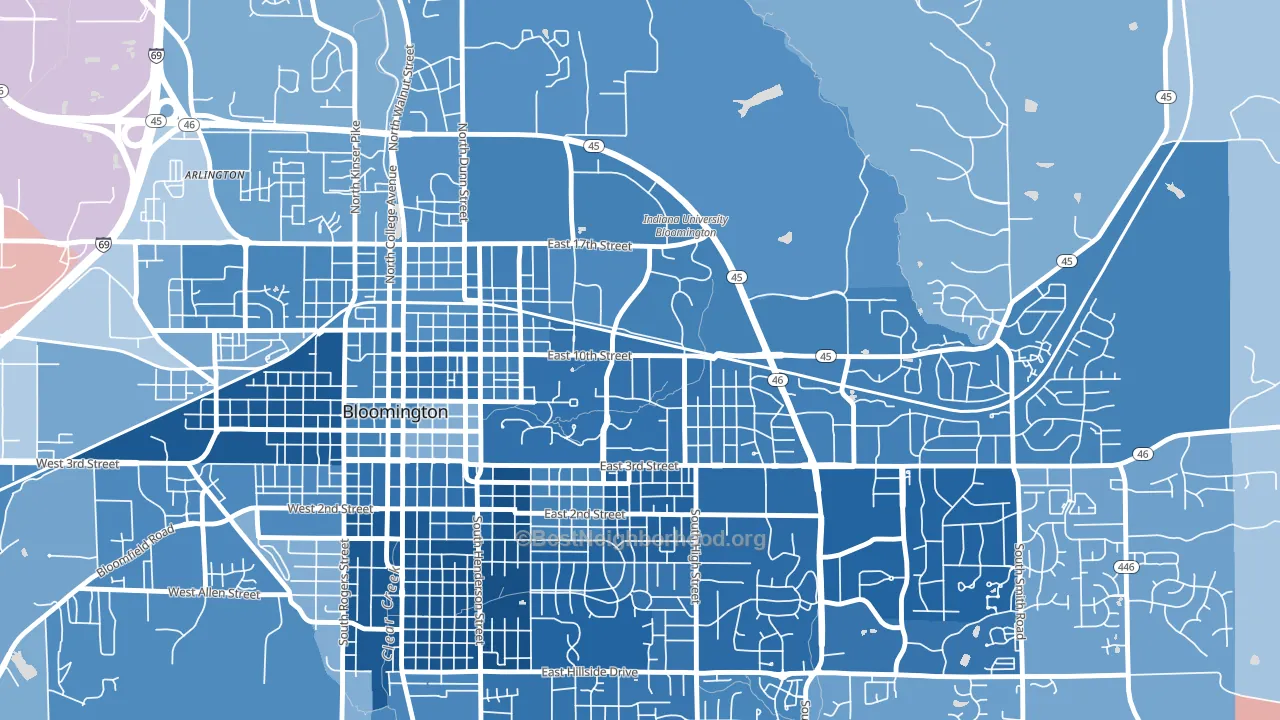
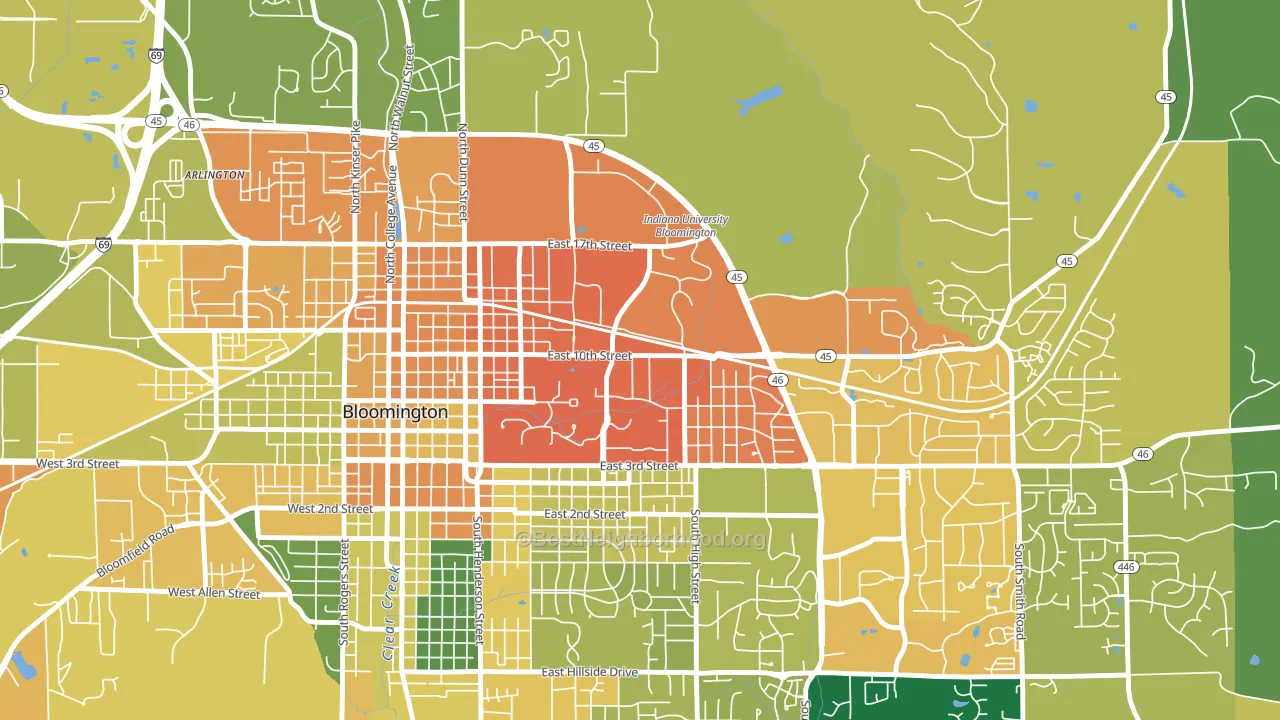
About 20% of adults in Indiana University typically vote, below the U.S. average of about 62%. Among adults in Indiana University, ~16% vote Democratic, ~4% Republican, and ~80% don't vote. The map below shows estimated turnout by block group.
How Indiana University compares
Indiana University runs about 79 points more Democratic than Indiana as a whole. Indiana leans Republican overall, while Indiana University is one of the few Democratic-leaning pockets.
Politics vary noticeably by block within Indiana University. The northwest side is the most Democratic-leaning (D+68) and the north side is the least Democratic-leaning (D+46), a spread of about 21 points.
Why Indiana University leans the way it does
This analysis examined 14,881 data points per neighborhood to find what predicts political lean and turnout. The items below are a few correlations that stood out for Indiana University, not a ranked or complete list of what matters most.
Areas with high college attainment vote Democratic. About 89% of adults in Indiana University hold a bachelor's degree, about 60 points above the U.S. average of 28%. A high never-married share predicts Democratic voting, and about 99% of adults in Indiana University have never been married, in the top fraction of neighborhoods. Indiana University runs against the grain of Indiana, a Democratic-leaning pocket in a Republican-leaning state.
Population density and Democratic lean
Places with high population density tend to lean Democratic; Indiana University, Bloomington, IN sits in the top tenth nationally on this measure.
Why turnout in Indiana University looks the way it does
Renters vote less often than owners. About 99% of households in Indiana University rent, about 74 points above the U.S. average of 25%. High food insecurity lines up with lower turnout, and about 36% of adults in Indiana University report food insecurity, above 89% of neighborhoods. Low high-school completion lines up with lower turnout, and more than 99% of adults in Indiana University have completed high school, above 96% of neighborhoods. Learn more about the findings and methodology on the political spectrum map.
Nearby Neighborhoods
- Old Northeast, Bloomington, IN D+64
- East Columbus, Columbus, IN R+21
- Everroad Park, Columbus, IN R+22
- West Edgewood, Indianapolis, IN Even
- University Heights and Rosedale Hills, Indianapolis, IN D+13
- Carson Square, Indianapolis, IN R+6
- Carson Heights, Indianapolis, IN D+13
- Chapel Hill Village, Indianapolis, IN D+33
- New Bethel, Indianapolis, IN R+17
- Downtown Indianapolis, Indianapolis, IN D+54
Neighborhoods with Similar Populations
- Riverside, Baltimore, MD D+64
- Lakeview-Bakersfield, Bakersfield, CA D+25
- Corbett-Terwilliger-Lair Hill, Portland, OR D+68
- City College Area, Long Beach, CA D+18
- East Raleigh, Raleigh, NC D+64
- Moreno Mission, San Diego, CA D+40
- Merle Hay, Des Moines, IA D+24
- Jordan, Minneapolis, MN D+63
- Downtown Elizabeth, Elizabeth, NJ D+27
- Claytown, Detroit, MI D+16
Sources and methodology
Precinct-level voting records used to fit the model come from Indiana Secretary of State, Elections, distributed by the Voting and Election Science Team. Demographic inputs come from the U.S. Census Bureau (ACS 5-year estimates and the 2020 Decennial Census). Health and environmental inputs come from the CDC (PLACES and the Environmental Justice Index). Land cover comes from the USGS and EPA. Election-day and lead-up weather come from PRISM 4km daily grids and the NOAA Global Historical Climatology Network. Mail-voting and election-administration patterns come from the MIT Election Lab's Survey of the Performance of American Elections. Block-group crime detail comes from CrimeGrade. Internet data and modeling support provided by ISPreports.org.
Modeling and analysis by the BestNeighborhood data science team. Full methodology and findings: political spectrum map.
Methodology reviewed by the BestNeighborhood data team. Last updated May 2026.