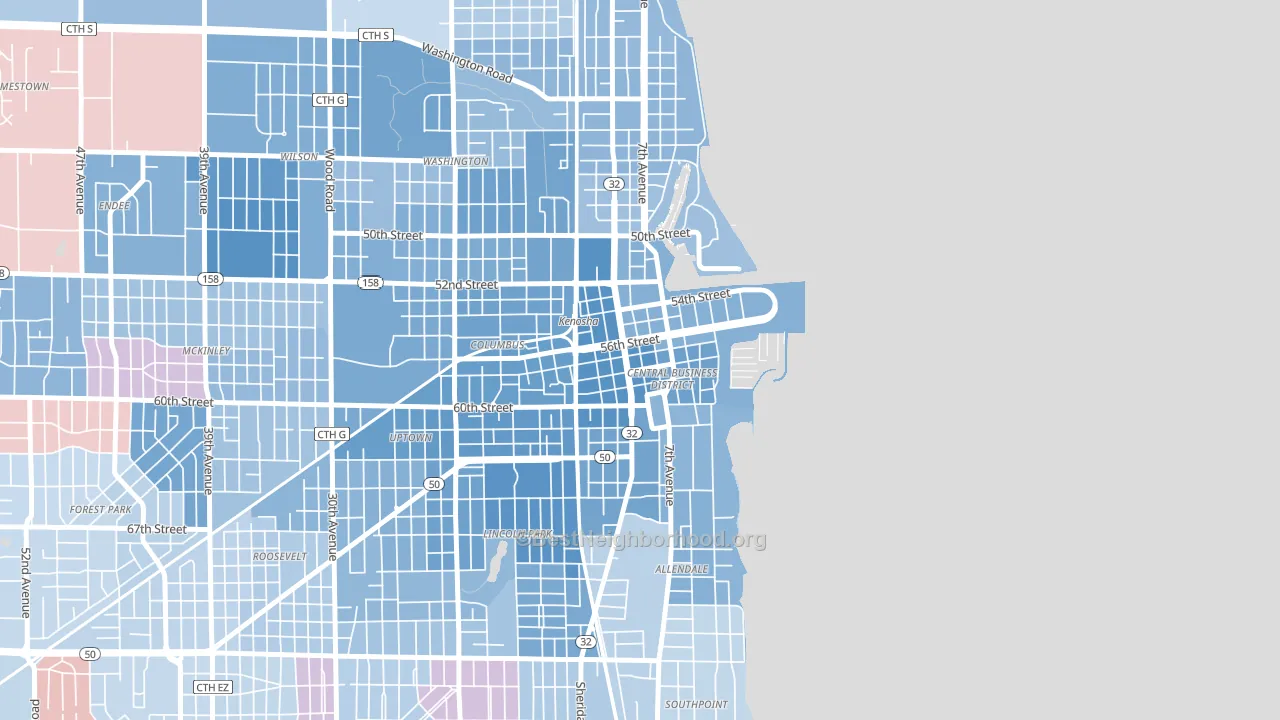
Downtown leans heavily Democratic by roughly 36 points: about 68% of voters vote Democratic and 32% Republican.
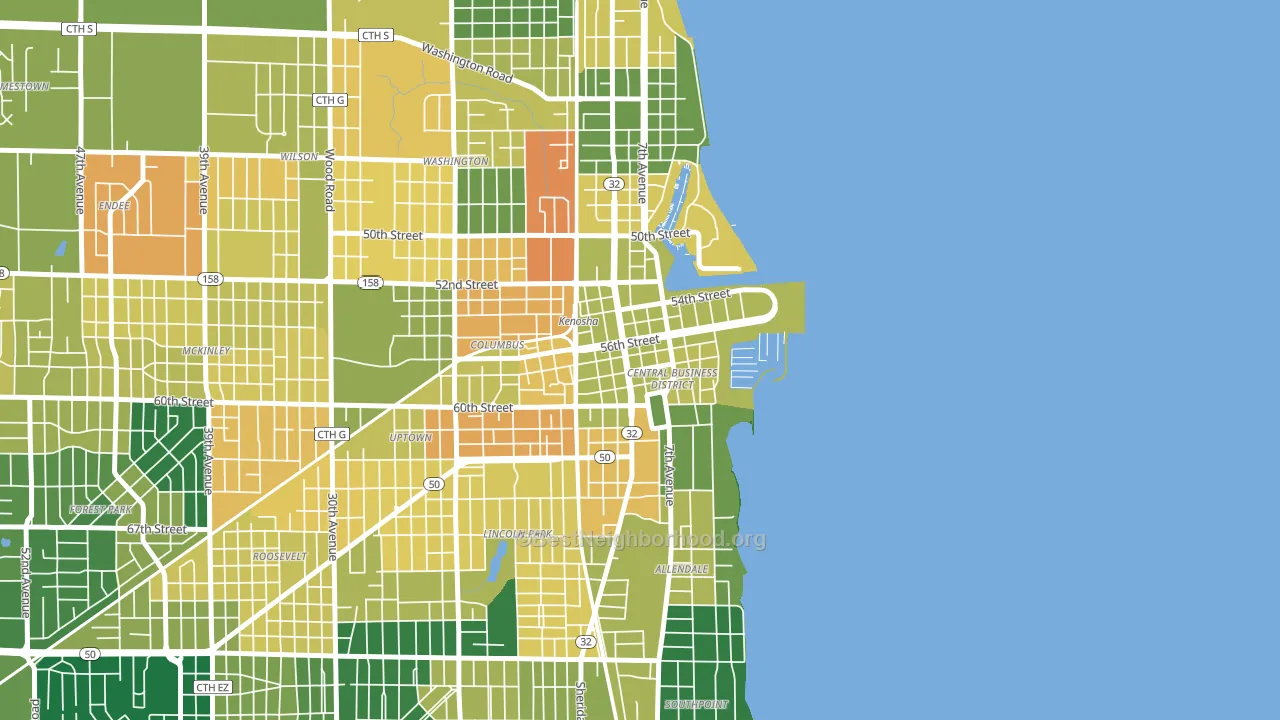
About 59% of adults in Downtown typically vote, near the U.S. average of about 62%. Among adults in Downtown, ~40% vote Democratic, ~19% Republican, and ~41% don't vote. The map below shows estimated turnout by block group.
How Downtown compares
Downtown sits in a sparsely populated area with few comparable neighborhoods nearby.
Downtown runs about 38 points more Democratic than Wisconsin as a whole. Wisconsin is roughly evenly split, and Downtown sits clearly on the Democratic side.
Politics vary noticeably by block within Downtown. The southwest side is the most Democratic-leaning (D+44) and the southeast side is the least Democratic-leaning (D+33), a spread of about 11 points.
Why Downtown leans the way it does
This analysis examined 14,881 data points per neighborhood to find what predicts political lean and turnout. The items below are a few correlations that stood out for Downtown, not a ranked or complete list of what matters most.
Downtown votes against the grain of Wisconsin. Wisconsin is roughly evenly split, while Downtown runs about 38 points more Democratic. A high never-married share predicts Democratic voting, and about 49% of adults in Downtown have never been married, above 80% of neighborhoods.
Paved land cover and Democratic lean
Places with extensive paved surfaces tend to lean Democratic; Downtown, Kenosha, WI sits in the top tenth nationally on this measure. Paved ground does not change how people vote; it mostly reflects how urban and built-up a place is.
Why turnout in Downtown looks the way it does
Renters vote less often than owners. About 65% of households in Downtown rent, about 40 points above the U.S. average of 25%. High-crime urban areas turn out at lower rates, and Downtown sits in the top 15% on a violent-crime measure. Learn more about the findings and methodology on the political spectrum map.
Nearby Neighborhoods
Neighborhoods with Similar Populations
- Queens-Magnolia Terrace, Jackson, MS D+86
- Downtown Tampa, Tampa, FL D+17
- Tice, Fort Myers, FL D+10
- Greendale Village, Needham, MA D+42
- Vale and Eastern Avenue, Schenectady, NY D+42
- Southchase Village, Southchase, FL D+7
- Columbia Center, Hammond, IN D+38
- Downtown, Portland, ME D+68
- Grafton Hill, Worcester, MA D+19
- Parsons, Wilkes-Barre, PA R+9
Sources and methodology
Precinct-level voting records used to fit the model come from Wisconsin Elections Commission, distributed by the Voting and Election Science Team. Demographic inputs come from the U.S. Census Bureau (ACS 5-year estimates and the 2020 Decennial Census). Health and environmental inputs come from the CDC (PLACES and the Environmental Justice Index). Land cover comes from the USGS and EPA. Election-day and lead-up weather come from PRISM 4km daily grids and the NOAA Global Historical Climatology Network. Mail-voting and election-administration patterns come from the MIT Election Lab's Survey of the Performance of American Elections. Block-group crime detail comes from CrimeGrade. Internet data and modeling support provided by ISPreports.org.
Modeling and analysis by the BestNeighborhood data science team. Full methodology and findings: political spectrum map.
Methodology reviewed by the BestNeighborhood data team. Last updated May 2026.