White Caps is a true toss-up. About 52% of voters here vote Democratic and 48% Republican.
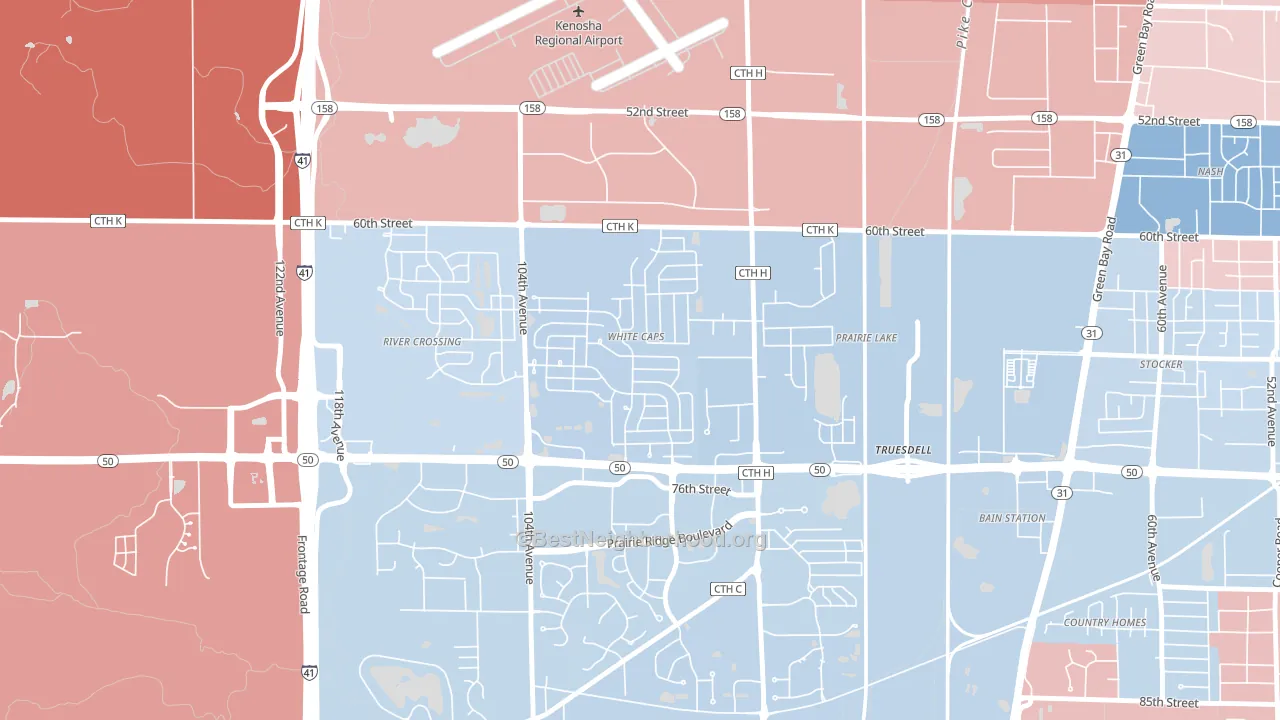
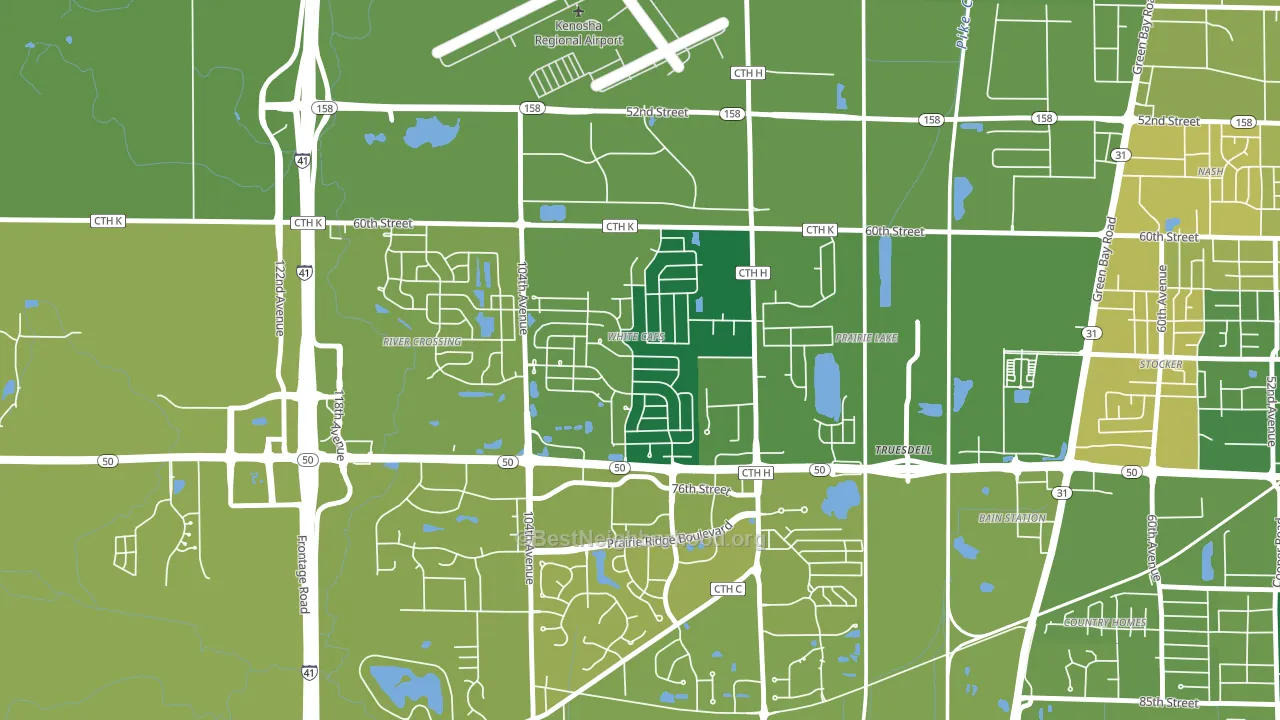
About more than 99% of adults in White Caps typically vote, above the U.S. average of about 62%. Among adults in White Caps, ~52% vote Democratic, ~48% Republican, and ~0% don't vote. The map below shows estimated turnout by block group.
How White Caps compares
White Caps sits in a sparsely populated area with few comparable neighborhoods nearby.
White Caps runs about 5 points more Democratic than Wisconsin as a whole.
Why White Caps leans the way it does
Density, race composition, education, and family structure all sit close to their national averages in White Caps. The lean here lands roughly where demographic data alone would predict.
Homeownership and voter turnout
Places with homeowner-heavy households tend to turn out at a higher rate; White Caps, Kenosha, WI sits in the top quarter nationally on this measure.
Why turnout in White Caps looks the way it does
Homeowners vote more often than renters. About 92% of households in White Caps own their home, about 12 points above the Wisconsin average of 80%. Learn more about the findings and methodology on the political spectrum map.
Nearby Neighborhoods
- Lance, Kenosha, WI D+7
- Isetts, Kenosha, WI D+9
- Downtown, Kenosha, WI D+37
- Camp Lake, Trevor, WI R+25
- Uptown, Racine, WI D+59
- Five Points, Great Lakes, IL D+42
- Orchard Meadows, Mundelein, IL D+15
- Woodlands at Fiore, Buffalo Grove, IL D+26
- Mitchell West, Milwaukee, WI D+9
- Castle Manor, Milwaukee, WI D+15
Neighborhoods with Similar Populations
- Holly, Austin, TX D+62
- Town of Blake, South Daytona, FL R+13
- Historic Uptown, St. Petersburg, FL D+34
- South Wedge, Rochester, NY D+70
- Lake Terrace and Oaks, New Orleans, LA D+41
- Point Richmond, Richmond, CA D+66
- Providence Estates East, Matthews, NC D+3
- Northwest Berkeley, Berkeley, CA D+82
- Midway Place, Bryan, TX D+31
- Duclay Forest, Jacksonville, FL D+32
Sources and methodology
Precinct-level voting records used to fit the model come from Wisconsin Elections Commission, distributed by the Voting and Election Science Team. Demographic inputs come from the U.S. Census Bureau (ACS 5-year estimates and the 2020 Decennial Census). Health and environmental inputs come from the CDC (PLACES and the Environmental Justice Index). Land cover comes from the USGS and EPA. Election-day and lead-up weather come from PRISM 4km daily grids and the NOAA Global Historical Climatology Network. Mail-voting and election-administration patterns come from the MIT Election Lab's Survey of the Performance of American Elections. Block-group crime detail comes from CrimeGrade. Internet data and modeling support provided by ISPreports.org.
Modeling and analysis by the BestNeighborhood data science team. Full methodology and findings: political spectrum map.
Methodology reviewed by the BestNeighborhood data team. Last updated May 2026.