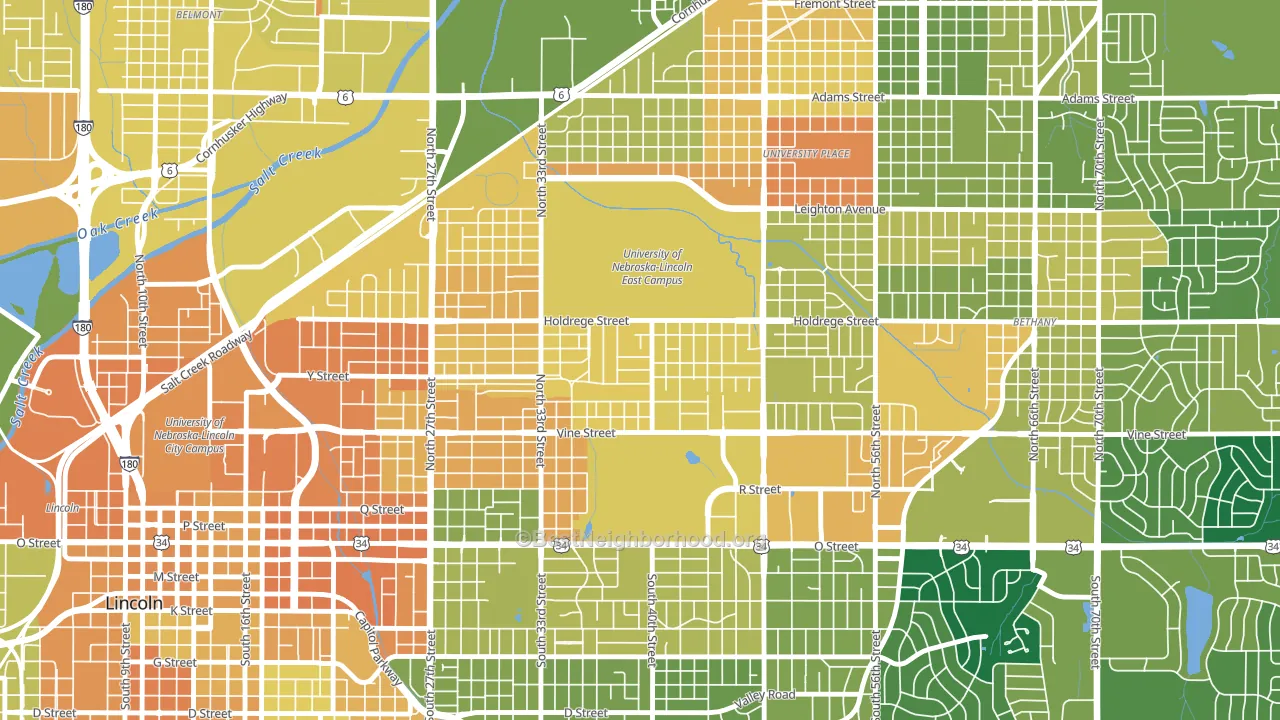
East Campus leans heavily Democratic by roughly 46 points: about 73% of voters vote Democratic and 27% Republican.
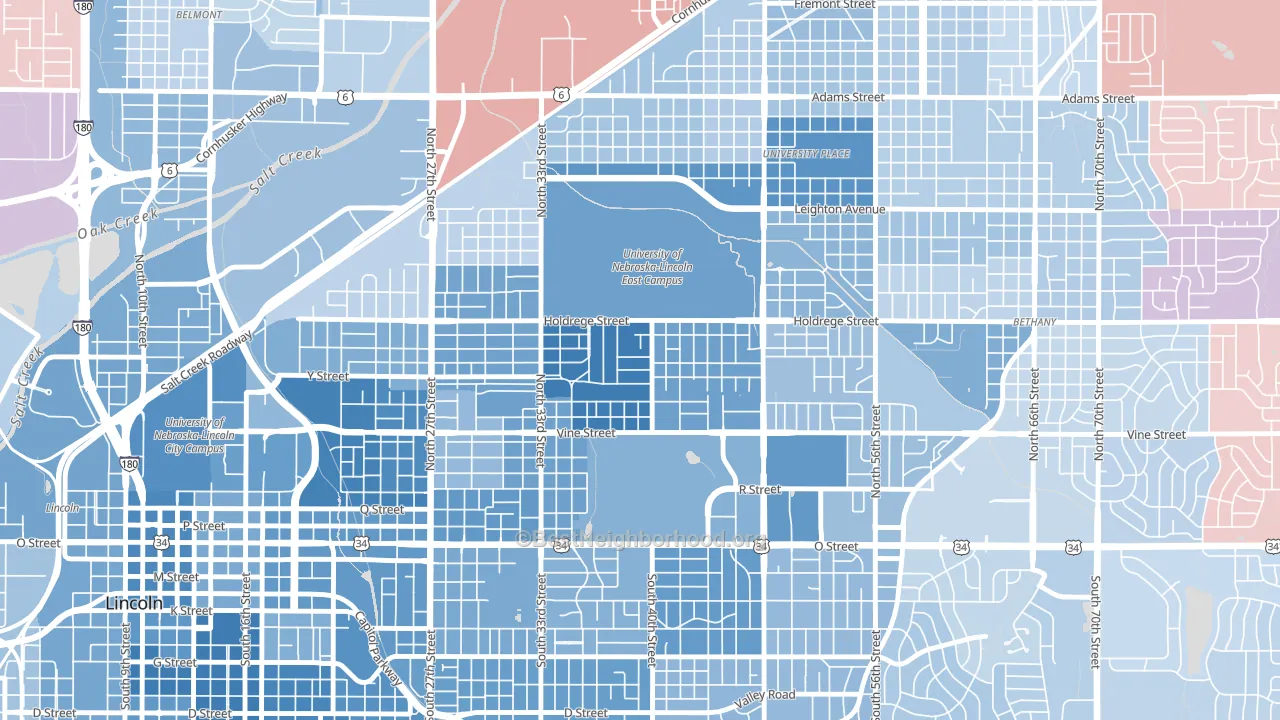
About 53% of adults in East Campus typically vote, below the U.S. average of about 62%. Among adults in East Campus, ~39% vote Democratic, ~14% Republican, and ~47% don't vote. The map below shows estimated turnout by block group.
How East Campus compares
Among neighborhoods within 5 miles, East Campus is the most Democratic-leaning.
East Campus runs about 66 points more Democratic than Nebraska as a whole. Nebraska leans Republican overall, while East Campus is one of the few Democratic-leaning pockets.
Why East Campus leans the way it does
This analysis examined 14,881 data points per neighborhood to find what predicts political lean and turnout. The items below are a few correlations that stood out for East Campus, not a ranked or complete list of what matters most.
East Campus votes against the grain of Nebraska. Nebraska leans Republican overall, while East Campus runs about 66 points more Democratic. High college attainment predicts Democratic voting, and East Campus sits in the top quarter (about 60%, above 81% of neighborhoods). A high never-married share predicts Democratic voting, and about 51% of adults in East Campus have never been married, above 82% of neighborhoods.
Cholesterol-screening access and voter turnout
Places with low cholesterol-screening access tend to turn out at a lower rate; East Campus, Lincoln, NE sits in the bottom tenth nationally on this measure. Cholesterol screening does not drive turnout; it reflects income, insurance, and healthcare access.
Why turnout in East Campus looks the way it does
Turnout in East Campus sits close to the national pattern. Routine healthcare access, homeownership, education, and food security all land near their national averages here. Learn more about the findings and methodology on the political spectrum map.
Nearby Neighborhoods
- Hartley, Lincoln, NE D+36
- Clinton, Lincoln, NE D+32
- University Place, Lincoln, NE D+13
- Malone, Lincoln, NE D+38
- Woods Park, Lincoln, NE D+37
- Bethany, Lincoln, NE D+10
- 40th and A, Lincoln, NE D+28
- Downtown Lincoln, Lincoln, NE D+42
- Near South, Lincoln, NE D+44
- Meadowlane, Lincoln, NE D+3
Neighborhoods with Similar Populations
- Pinnacle Club, Grove City, OH R+9
- Pelican Marsh, Naples, FL R+21
- Yankee Hill, Milwaukee, WI D+57
- Indian Spring, Boynton Beach, FL D+18
- Vinton Street, Omaha, NE D+28
- Hunter Army Airfield, Savannah, GA D+4
- Golden Valley, Milwaukee, WI D+41
- Holualoa, Kailua-Kona, HI D+21
- West End, Greenville, SC D+35
- East Old Golden Road, West Pleasant View, CO D+21
Sources and methodology
Precinct-level voting records used to fit the model come from Nebraska Secretary of State, Elections, distributed by the Voting and Election Science Team. Demographic inputs come from the U.S. Census Bureau (ACS 5-year estimates and the 2020 Decennial Census). Health and environmental inputs come from the CDC (PLACES and the Environmental Justice Index). Land cover comes from the USGS and EPA. Election-day and lead-up weather come from PRISM 4km daily grids and the NOAA Global Historical Climatology Network. Mail-voting and election-administration patterns come from the MIT Election Lab's Survey of the Performance of American Elections. Block-group crime detail comes from CrimeGrade. Internet data and modeling support provided by ISPreports.org.
Modeling and analysis by the BestNeighborhood data science team. Full methodology and findings: political spectrum map.
Methodology reviewed by the BestNeighborhood data team. Last updated May 2026.