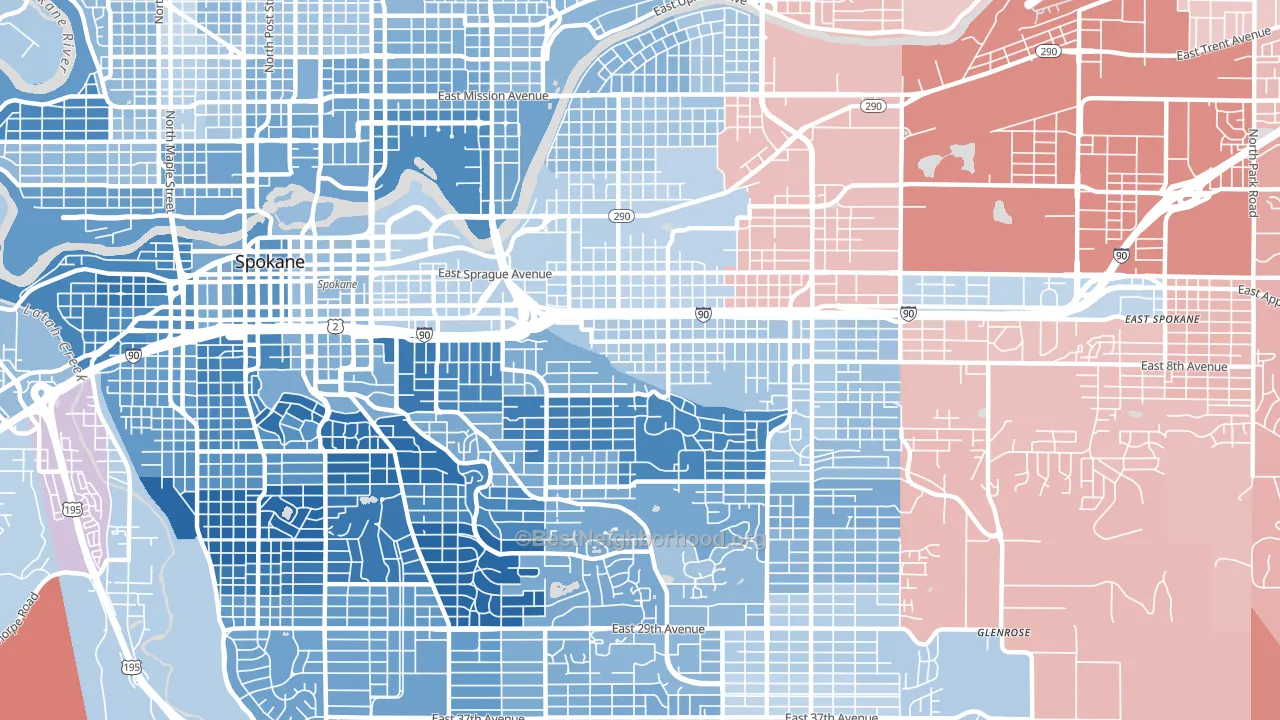
East Central leans Democratic by roughly 24 points: about 62% of voters vote Democratic and 38% Republican.
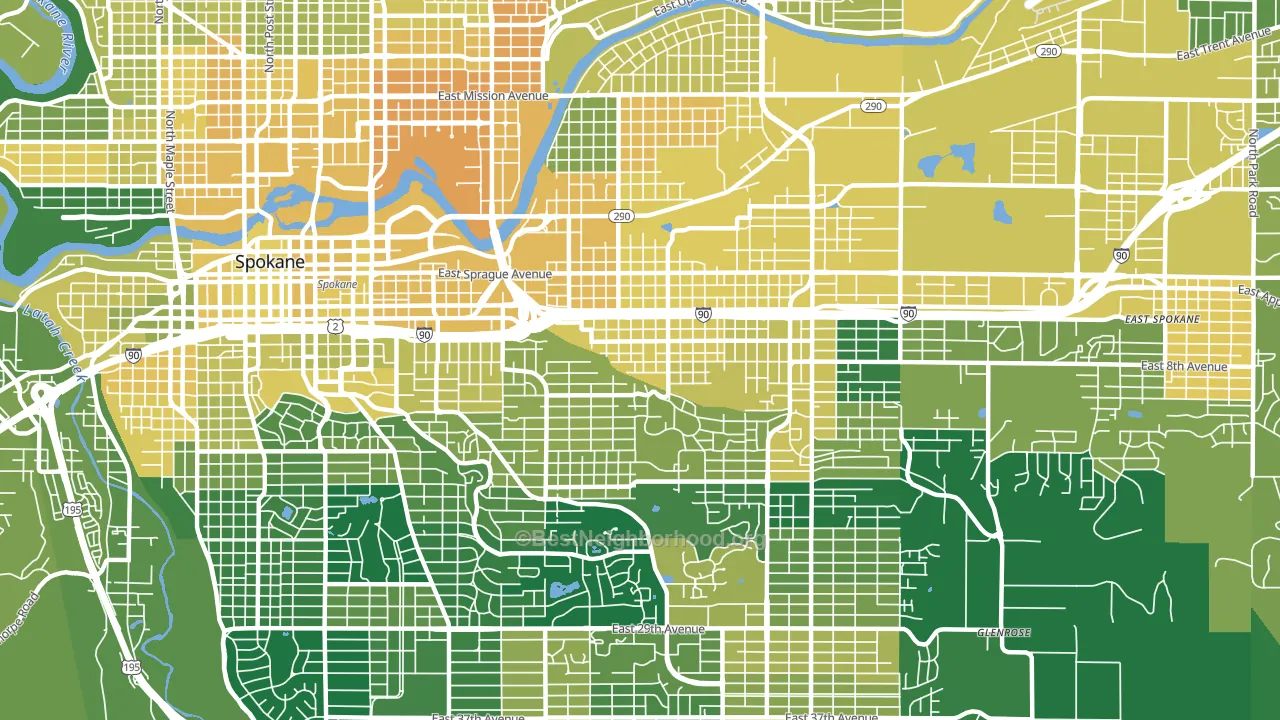
About 61% of adults in East Central typically vote, near the U.S. average of about 62%. Among adults in East Central, ~38% vote Democratic, ~23% Republican, and ~39% don't vote. The map below shows estimated turnout by block group.
How East Central compares
Among neighborhoods within 5 miles, East Central leans more Democratic than 11 of 18 neighbors.
East Central runs about 6 points more Democratic than Washington as a whole.
Politics vary noticeably by block within East Central. The southwest side runs the most Democratic (D+49) and the northeast side runs the most Republican (Even), a spread of about 50 points.
Why East Central leans the way it does
Density, race composition, education, and family structure all sit close to their national averages in East Central. The lean here lands roughly where demographic data alone would predict.
Cholesterol-screening access and voter turnout
Places with low cholesterol-screening access tend to turn out at a lower rate; East Central, Spokane, WA sits in the bottom quarter nationally on this measure. Cholesterol screening does not drive turnout; it reflects income, insurance, and healthcare access.
Why turnout in East Central looks the way it does
High-crime urban areas turn out at lower rates, mostly because the housing stress common in those areas makes voting harder. East Central sits in the top 15% nationally on a violent-crime measure. See CrimeGrade for more details. Learn more about the findings and methodology on the political spectrum map.
Nearby Neighborhoods
Neighborhoods with Similar Populations
- Walker Mill, District Heights, MD D+86
- North Coconut Grove, Miami, FL D+13
- Glen Park, Gary, IN D+79
- North Hayward, Hayward, CA D+42
- Groveton, Alexandria, VA D+49
- Tall Timbers, New Orleans, LA D+65
- Florida Center North, Orlando, FL D+24
- Mandarin Station-Losco, Jacksonville, FL R+24
- Squirrel Hill North, Pittsburgh, PA D+69
- West A, Lincoln, NE D+2
Sources and methodology
Precinct-level voting records used to fit the model come from Washington Secretary of State, Elections, distributed by the Voting and Election Science Team. Demographic inputs come from the U.S. Census Bureau (ACS 5-year estimates and the 2020 Decennial Census). Health and environmental inputs come from the CDC (PLACES and the Environmental Justice Index). Land cover comes from the USGS and EPA. Election-day and lead-up weather come from PRISM 4km daily grids and the NOAA Global Historical Climatology Network. Mail-voting and election-administration patterns come from the MIT Election Lab's Survey of the Performance of American Elections. Block-group crime detail comes from CrimeGrade. Internet data and modeling support provided by ISPreports.org.
Modeling and analysis by the BestNeighborhood data science team. Full methodology and findings: political spectrum map.
Methodology reviewed by the BestNeighborhood data team. Last updated May 2026.