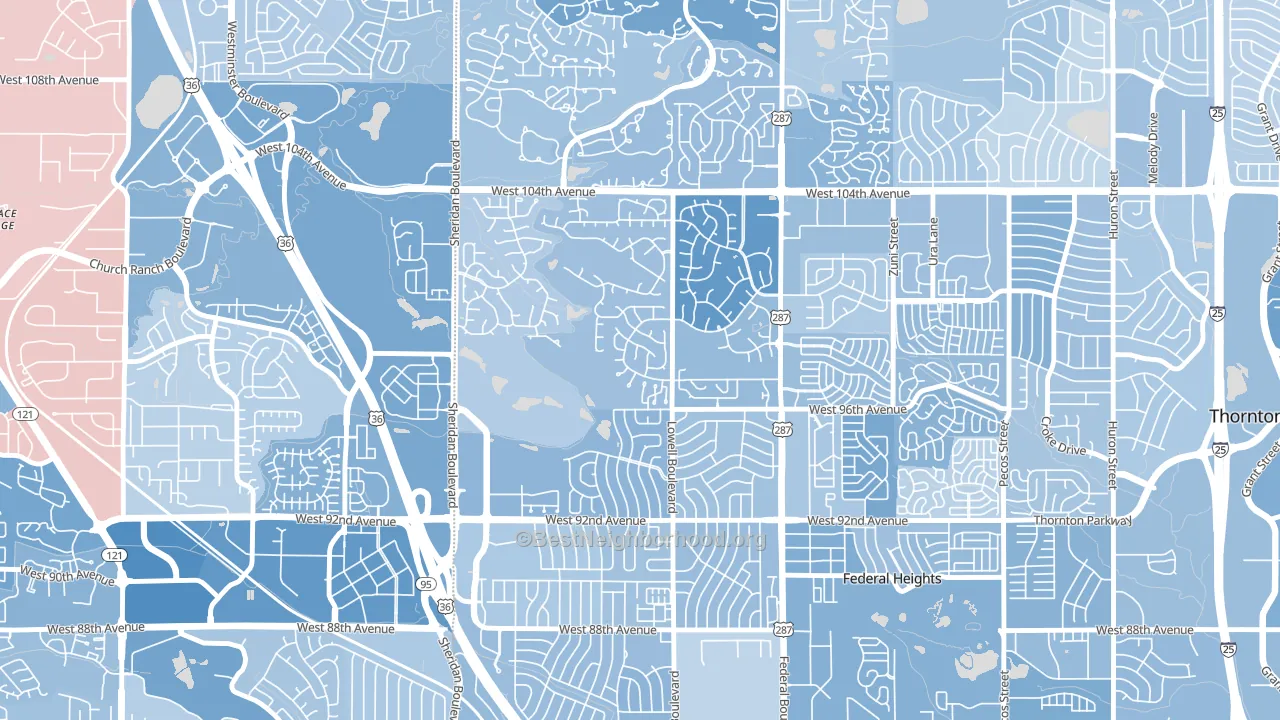
East Central Westminster leans Democratic by roughly 18 points: about 59% of voters vote Democratic and 41% Republican.
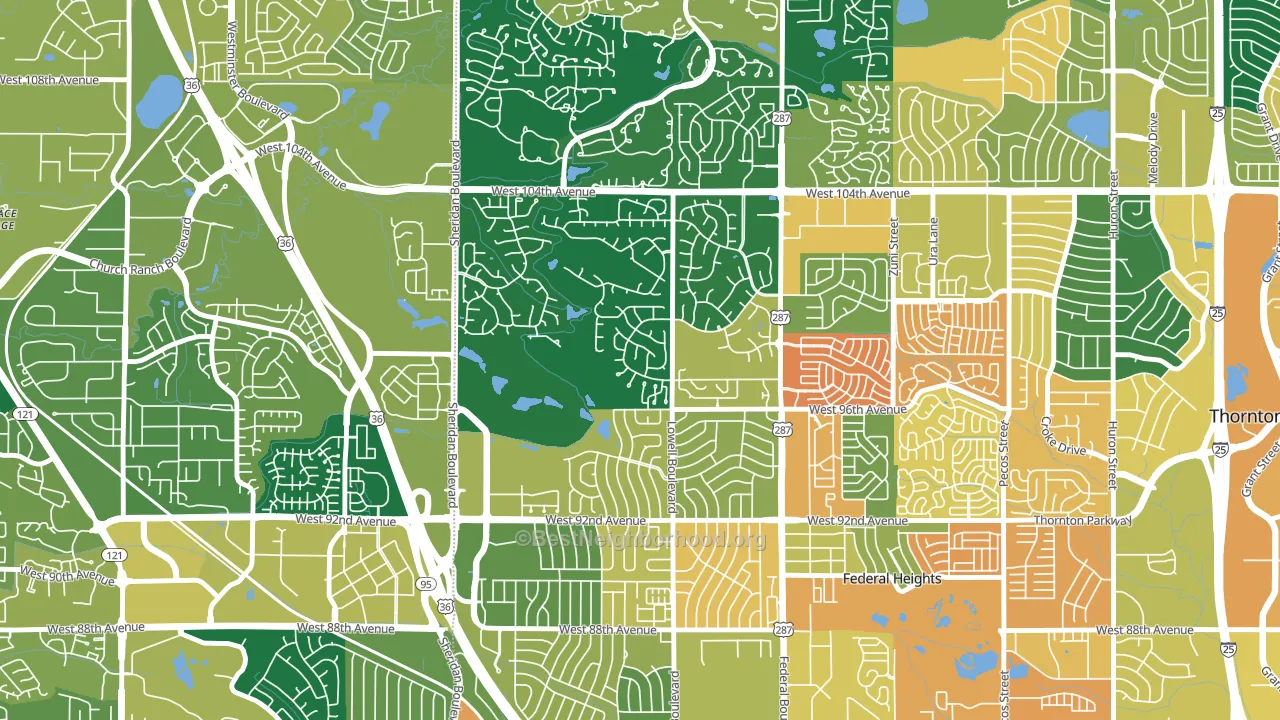
About 87% of adults in East Central Westminster typically vote, above the U.S. average of about 62%. Among adults in East Central Westminster, ~51% vote Democratic, ~36% Republican, and ~13% don't vote. The map below shows estimated turnout by block group.
How East Central Westminster compares
Among neighborhoods within 5 miles, East Central Westminster leans more Democratic than 3 of 12 neighbors.
East Central Westminster runs about 7 points more Democratic than Colorado as a whole.
Politics vary noticeably by block within East Central Westminster. The northeast side is the most Democratic-leaning (D+30) and the northwest side is the least Democratic-leaning (D+10), a spread of about 20 points.
Why East Central Westminster leans the way it does
This analysis examined 14,881 data points per neighborhood to find what predicts political lean and turnout. The items below are a few correlations that stood out for East Central Westminster, not a ranked or complete list of what matters most.
Dense areas vote Democratic. More than 99% of residents in East Central Westminster live in densely developed areas, about 64 points above the U.S. average of 36%.
Preventive-care access and voter turnout
Places with strong routine preventive-care access tend to turn out at a higher rate; East Central Westminster, Westminster, CO sits above the national average on this measure. Dental visits do not drive turnout; the rate reflects income, insurance, and healthcare access, which line up with who votes.
Why turnout in East Central Westminster looks the way it does
Turnout in East Central Westminster sits close to the national pattern. Routine healthcare access, homeownership, education, and food security all land near their national averages here. Learn more about the findings and methodology on the political spectrum map.
Nearby Neighborhoods
- South Central Westminster, Westminster, CO D+19
- North Central Westminster, Westminster, CO D+22
- South Westminster, Westminster, CO D+20
- Kings Mill, Broomfield, CO D+24
- Village at North Hills, Northglenn, CO D+18
- Brandywine, Broomfield, CO D+24
- Twin Lakes, Denver, CO D+27
- Original Thornton, Thornton, CO D+17
- Walnut Grove, Broomfield, CO D+15
- Lamar Heights Area, Arvada, CO D+20
Neighborhoods with Similar Populations
- Westlake Village Area-Los Angeles, Westlake Village, CA D+13
- Southside, Augusta, GA D+48
- Devington, Indianapolis, IN D+78
- Pembroke, Detroit, MI D+89
- Airport, Detroit, MI D+57
- Beechhurst, Queens, NY R+20
- Westborough, South San Francisco, CA D+41
- Land Park, Sacramento, CA D+63
- Deep Creek West, Chesapeake, VA D+5
- Lower Bal, San Leandro, CA D+39
Sources and methodology
Precinct-level voting records used to fit the model come from Colorado Secretary of State, Elections, distributed by the Voting and Election Science Team. Demographic inputs come from the U.S. Census Bureau (ACS 5-year estimates and the 2020 Decennial Census). Health and environmental inputs come from the CDC (PLACES and the Environmental Justice Index). Land cover comes from the USGS and EPA. Election-day and lead-up weather come from PRISM 4km daily grids and the NOAA Global Historical Climatology Network. Mail-voting and election-administration patterns come from the MIT Election Lab's Survey of the Performance of American Elections. Block-group crime detail comes from CrimeGrade. Internet data and modeling support provided by ISPreports.org.
Modeling and analysis by the BestNeighborhood data science team. Full methodology and findings: political spectrum map.
Methodology reviewed by the BestNeighborhood data team. Last updated May 2026.