Southside leans heavily Democratic by roughly 48 points: about 74% of voters vote Democratic and 26% Republican.
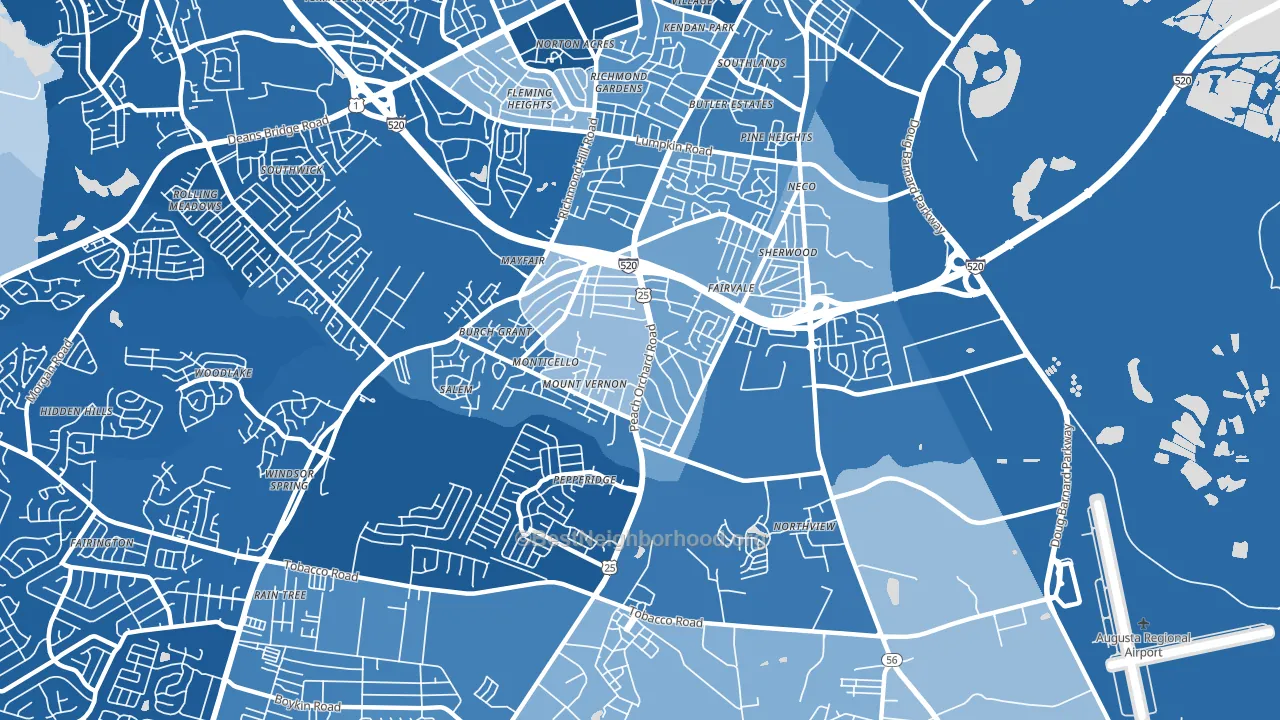
About 55% of adults in Southside typically vote, below the U.S. average of about 62%. Among adults in Southside, ~41% vote Democratic, ~14% Republican, and ~45% don't vote. The map below shows estimated turnout by block group.
How Southside compares
Among neighborhoods within 5 miles, Southside leans more Democratic than 3 of 12 neighbors.
Southside runs about 51 points more Democratic than Georgia as a whole. Georgia is roughly evenly split, and Southside sits clearly on the Democratic side.
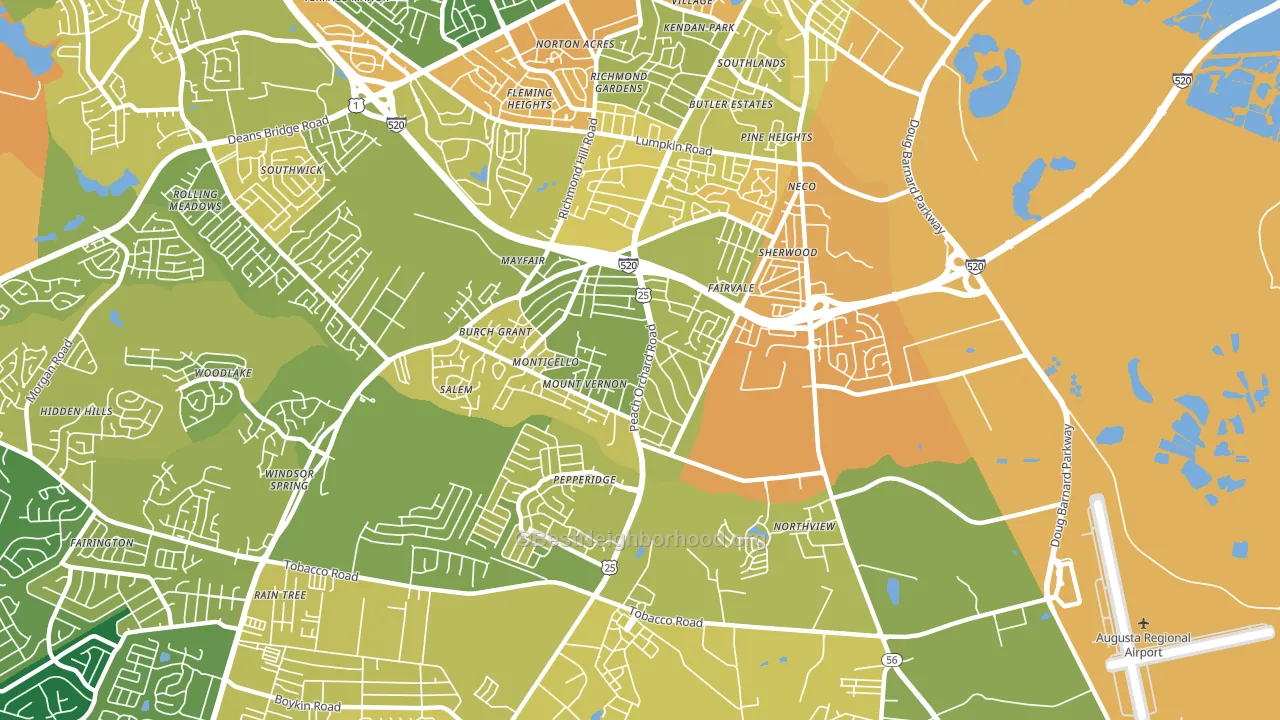
Politics vary noticeably by block within Southside. The southeast side is the most Democratic-leaning (D+68) and the northwest side is the least Democratic-leaning (D+22), a spread of about 46 points.
Why Southside leans the way it does
This analysis examined 14,881 data points per neighborhood to find what predicts political lean and turnout. The items below are a few correlations that stood out for Southside, not a ranked or complete list of what matters most.
Southside votes against the grain of Georgia. Georgia is roughly evenly split, while Southside runs about 51 points more Democratic. A high never-married share predicts Democratic voting, and about 49% of adults in Southside have never been married, above 81% of neighborhoods.
Preventive-care access and voter turnout
Places with limited routine preventive-care access tend to turn out at a lower rate; Southside, Augusta, GA sits in the bottom tenth nationally on this measure. Dental visits do not drive turnout; the rate reflects income, insurance, and healthcare access, which line up with who votes.
Why turnout in Southside looks the way it does
Areas with limited routine healthcare access turn out at lower rates. Southside is in the bottom quarter nationally for routine-care measures such as insurance coverage, preventive screenings, and dental visits. The dental-visit rate here is about 42%, about 14 points below the Georgia average of 56%. High food insecurity lines up with lower turnout, and about 36% of adults in Southside report food insecurity, above 90% of neighborhoods. Low high-school completion lines up with lower turnout, and about 83% of adults in Southside have completed high school, below 80% of neighborhoods. Learn more about the findings and methodology on the political spectrum map.
Nearby Neighborhoods
- Pepperidge, Augusta, GA D+84
- Old Savannah, Augusta, GA D+40
- Richmond Hill, Augusta, GA D+56
- Meadowbrook, Augusta, GA D+77
- Wheeless Road, Augusta, GA D+63
- Richmond Factory, Augusta, GA D+53
- Windsor Spring, Hephzibah, GA D+69
- Barton Chapel, Augusta, GA D+73
- Goshen, Augusta, GA D+9
- Highland Park, Augusta, GA D+47
Neighborhoods with Similar Populations
- Devington, Indianapolis, IN D+78
- Pembroke, Detroit, MI D+89
- Westlake Village Area-Los Angeles, Westlake Village, CA D+13
- East Central Westminster, Westminster, CO D+18
- Airport, Detroit, MI D+57
- Beechhurst, Queens, NY R+20
- Lower Bal, San Leandro, CA D+39
- Westborough, South San Francisco, CA D+41
- Land Park, Sacramento, CA D+63
- Deep Creek West, Chesapeake, VA D+5
Sources and methodology
Precinct-level voting records used to fit the model come from Georgia Elections Division, distributed by the Voting and Election Science Team. Demographic inputs come from the U.S. Census Bureau (ACS 5-year estimates and the 2020 Decennial Census). Health and environmental inputs come from the CDC (PLACES and the Environmental Justice Index). Land cover comes from the USGS and EPA. Election-day and lead-up weather come from PRISM 4km daily grids and the NOAA Global Historical Climatology Network. Mail-voting and election-administration patterns come from the MIT Election Lab's Survey of the Performance of American Elections. Block-group crime detail comes from CrimeGrade. Internet data and modeling support provided by ISPreports.org.
Modeling and analysis by the BestNeighborhood data science team. Full methodology and findings: political spectrum map.
Methodology reviewed by the BestNeighborhood data team. Last updated May 2026.