East Hill leans heavily Democratic by roughly 30 points: about 65% of voters vote Democratic and 35% Republican.
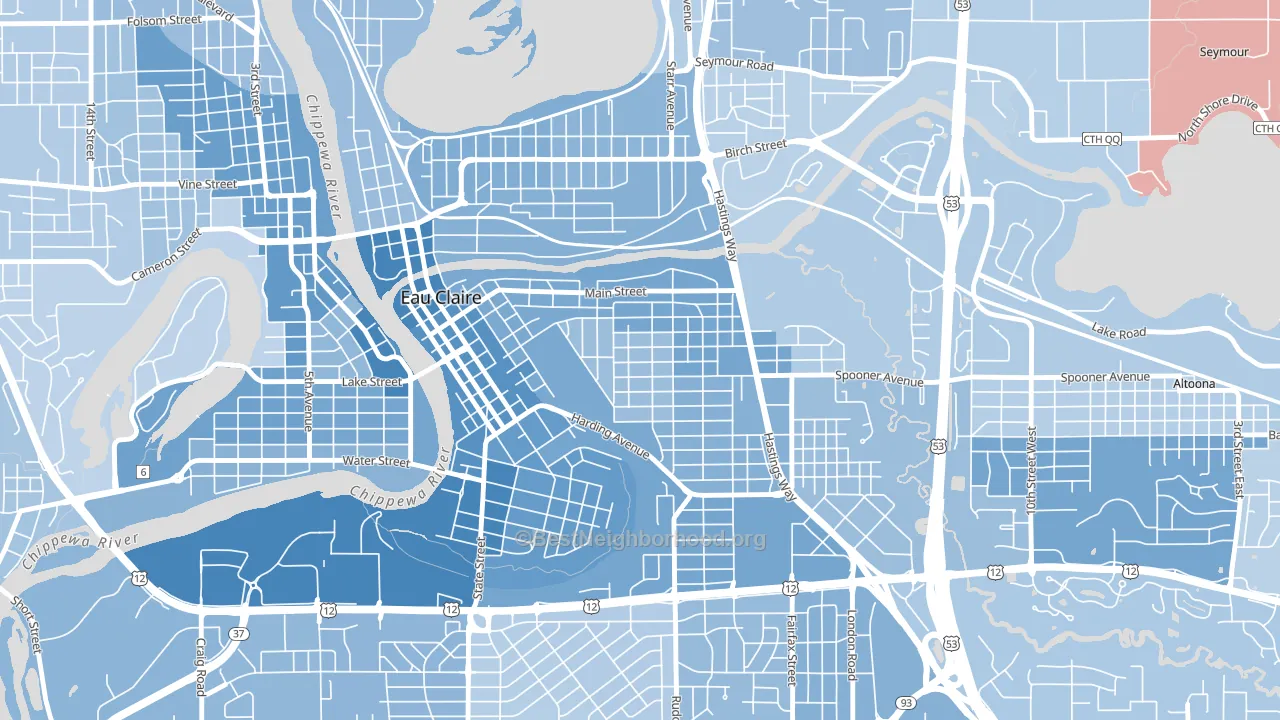
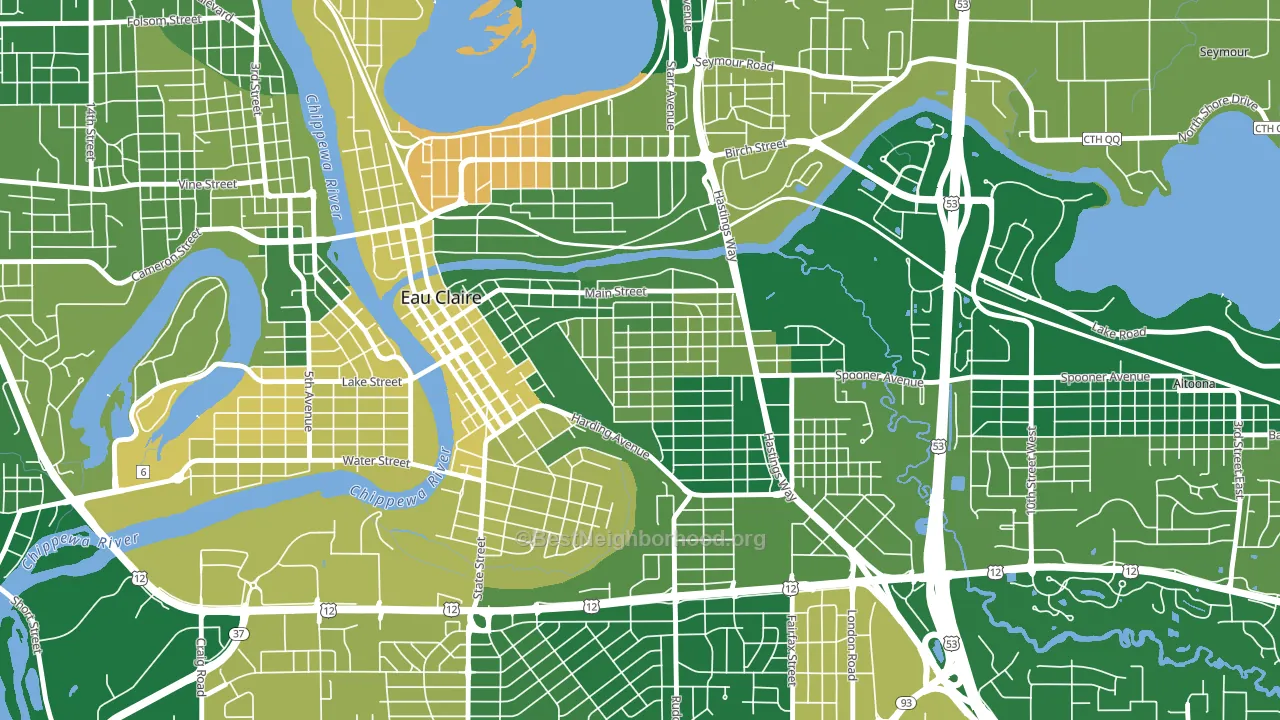
About 92% of adults in East Hill typically vote, above the U.S. average of about 62%. Among adults in East Hill, ~60% vote Democratic, ~32% Republican, and ~8% don't vote. The map below shows estimated turnout by block group.
How East Hill compares
Among neighborhoods within 5 miles, East Hill leans more Democratic than 3 of 4 neighbors.
East Hill runs about 31 points more Democratic than Wisconsin as a whole. Wisconsin is roughly evenly split, and East Hill sits clearly on the Democratic side.
Politics vary noticeably by block within East Hill. The northwest side is the most Democratic-leaning (D+33) and the northeast side is the least Democratic-leaning (D+20), a spread of about 13 points.
Why East Hill leans the way it does
This analysis examined 14,881 data points per neighborhood to find what predicts political lean and turnout. The items below are a few correlations that stood out for East Hill, not a ranked or complete list of what matters most.
East Hill votes against the grain of Wisconsin. Wisconsin is roughly evenly split, while East Hill runs about 31 points more Democratic.
High-school completion, uninsured rate, and voter turnout
Places that combine high-school-completion-heavy adults and a low uninsured rate tend to turn out at a higher rate, as East Hill, Eau Claire, WI does.
Why turnout in East Hill looks the way it does
Areas with strong routine healthcare access turn out at higher rates. East Hill is in the top quarter nationally for routine-care measures such as insurance coverage, preventive screenings, and dental visits. The dental-visit rate here is about 74%, about 14 points above the U.S. average of 60%. Learn more about the findings and methodology on the political spectrum map.
Nearby Neighborhoods
- North Side Hill, Eau Claire, WI D+22
- Third Ward, Eau Claire, WI D+45
- Randall Park, Eau Claire, WI D+29
- Putnam Heights, Eau Claire, WI D+20
- South Menomonie, Menomonie, WI D+14
- Cimarron, Rochester, MN D+25
- Elton Hills, Rochester, MN D+28
- Kutzky Park, Rochester, MN D+41
- Meadow Park, Rochester, MN D+13
- Battle Creek, St. Paul, MN D+39
Neighborhoods with Similar Populations
- Wheeling Avenue Historic District, Cambridge, OH R+29
- Shafter, Oakland, CA D+87
- Sidney Walnut Avenue Historic District, Sidney, OH R+37
- Fairmeadow, Munster, IN D+6
- Dunn's Marsh, Madison, WI D+61
- Cobb Park Area, Abilene, TX R+12
- College Park, Wilmington, NC D+32
- Reservoir, Providence, RI D+22
- Breezy Point, Queens, NY R+36
- Central, San Angelo, TX R+30
Sources and methodology
Precinct-level voting records used to fit the model come from Wisconsin Elections Commission, distributed by the Voting and Election Science Team. Demographic inputs come from the U.S. Census Bureau (ACS 5-year estimates and the 2020 Decennial Census). Health and environmental inputs come from the CDC (PLACES and the Environmental Justice Index). Land cover comes from the USGS and EPA. Election-day and lead-up weather come from PRISM 4km daily grids and the NOAA Global Historical Climatology Network. Mail-voting and election-administration patterns come from the MIT Election Lab's Survey of the Performance of American Elections. Block-group crime detail comes from CrimeGrade. Internet data and modeling support provided by ISPreports.org.
Modeling and analysis by the BestNeighborhood data science team. Full methodology and findings: political spectrum map.
Methodology reviewed by the BestNeighborhood data team. Last updated May 2026.