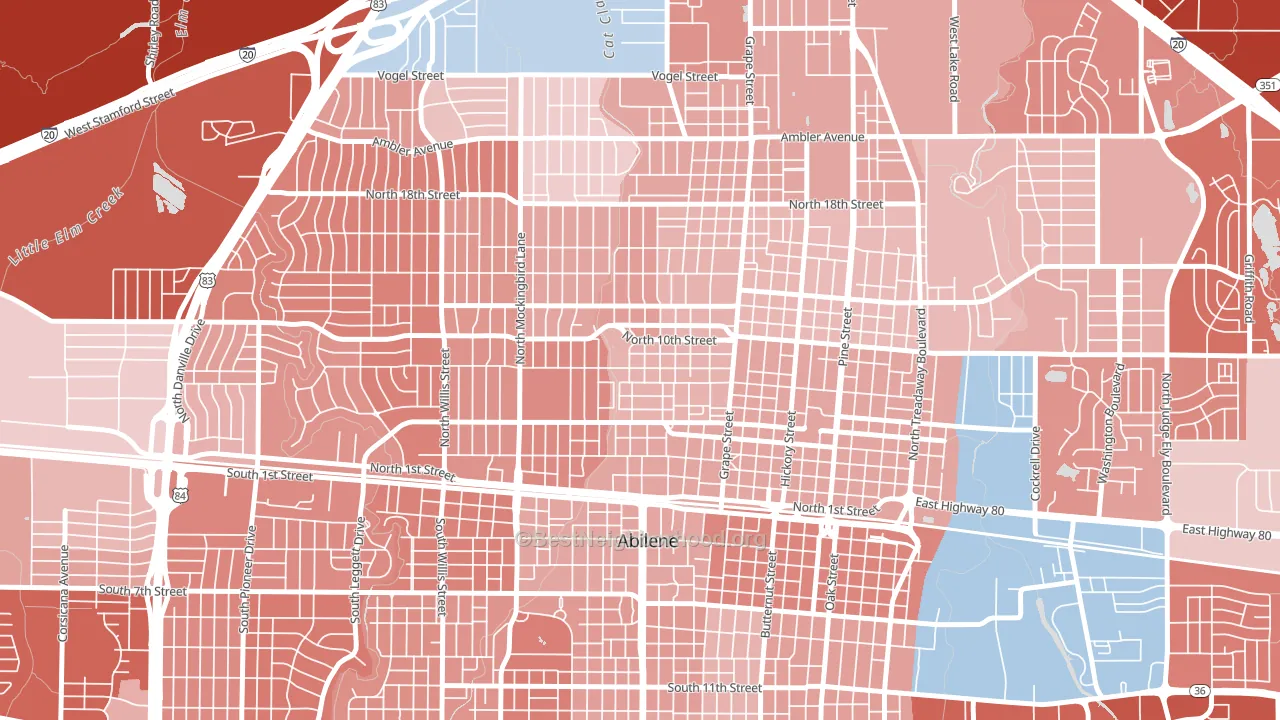
Cobb Park Area leans slightly Republican by roughly 12 points: about 44% of voters vote Democratic and 56% Republican.
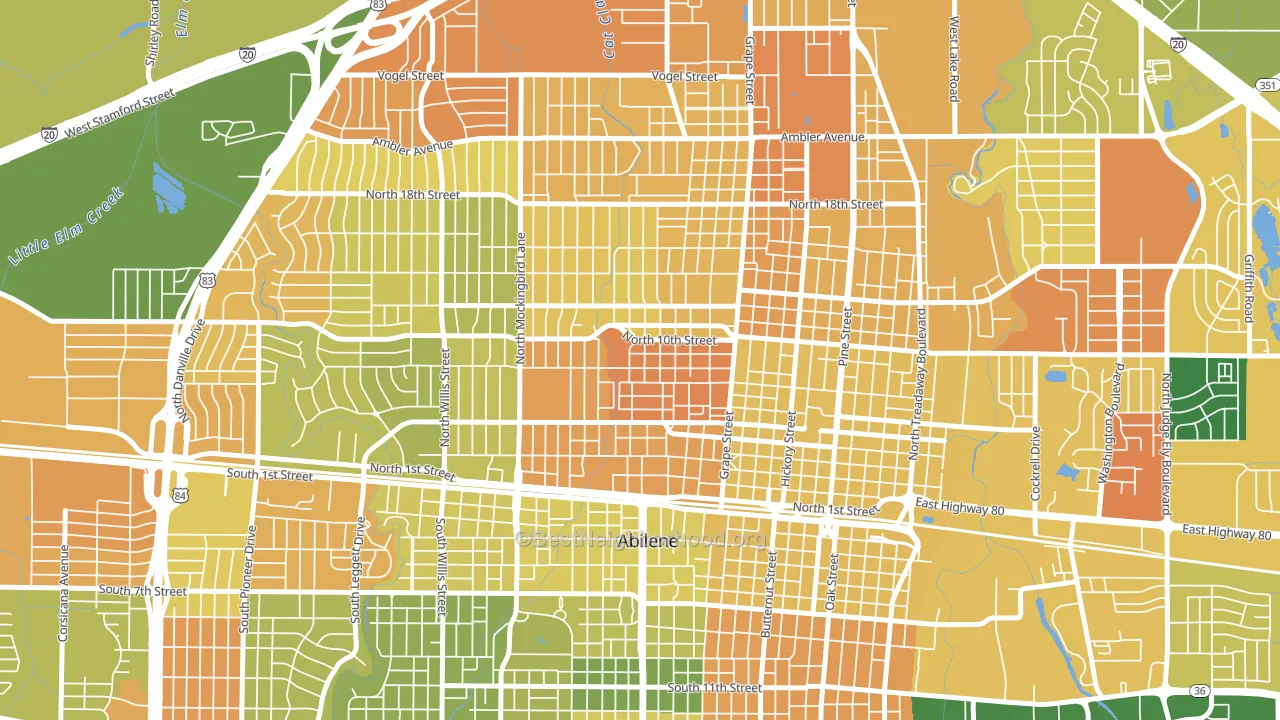
About 38% of adults in Cobb Park Area typically vote, below the U.S. average of about 62%. Among adults in Cobb Park Area, ~17% vote Democratic, ~21% Republican, and ~62% don't vote. The map below shows estimated turnout by block group.
How Cobb Park Area compares
Among neighborhoods within 5 miles, Cobb Park Area leans more Republican than 1 of 9 neighbors.
Politically, Cobb Park Area sits close to the rest of Texas.
Why Cobb Park Area leans the way it does
This analysis examined 14,881 data points per neighborhood to find what predicts political lean and turnout. The items below are a few correlations that stood out for Cobb Park Area, not a ranked or complete list of what matters most.
Cobb Park Area votes Republican even though it is densely developed (more than 99%, far above the Texas average of 35%). State and regional patterns outweigh the Democratic lean that density usually predicts here. Low college attainment predicts Republican voting, and Cobb Park Area sits in the bottom quarter (about 12%, below 90% of neighborhoods).
Cancer-screening access and voter turnout
Places with low colon-cancer-screening access tend to turn out at a lower rate; Cobb Park Area, Abilene, TX sits in the bottom tenth nationally on this measure. Cancer screening does not drive turnout; it reflects income, insurance, and healthcare access.
Why turnout in Cobb Park Area looks the way it does
Areas with limited routine healthcare access turn out at lower rates. Cobb Park Area is in the bottom quarter nationally for routine-care measures such as insurance coverage, preventive screenings, and dental visits. The dental-visit rate here is about 45%, about 9 points below the Texas average of 54%. Low high-school completion lines up with lower turnout, and about 80% of adults in Cobb Park Area have completed high school, below 86% of neighborhoods. High-crime urban areas turn out at lower rates, and Cobb Park Area sits in the top 15% on a violent-crime measure. Learn more about the findings and methodology on the political spectrum map.
Nearby Neighborhoods
- Sayles Boulevard Area, Abilene, TX R+17
- Sears Park Area, Abilene, TX R+7
- Westwood Richland, Abilene, TX R+18
- North College, Abilene, TX R+14
- Elmwood Area, Abilene, TX R+25
- Over Place Area, Abilene, TX R+30
- Abilene Heights Area, Abilene, TX R+24
- River Oaks-Brookhollow, Abilene, TX R+39
- Park Central Area, Abilene, TX R+16
- Chimney Rock Area, Abilene, TX R+46
Neighborhoods with Similar Populations
- College Park, Wilmington, NC D+32
- Reservoir, Providence, RI D+22
- Shafter, Oakland, CA D+87
- Loma Park, San Antonio, TX D+27
- Summerside, Cincinnati, OH R+32
- East Hill, Eau Claire, WI D+30
- Wheeling Avenue Historic District, Cambridge, OH R+29
- Fairmeadow, Munster, IN D+6
- Central West Denver, Denver, CO D+51
- Sidney Walnut Avenue Historic District, Sidney, OH R+37
Sources and methodology
Precinct-level voting records used to fit the model come from Texas Secretary of State, Elections Division, distributed by the Voting and Election Science Team. Demographic inputs come from the U.S. Census Bureau (ACS 5-year estimates and the 2020 Decennial Census). Health and environmental inputs come from the CDC (PLACES and the Environmental Justice Index). Land cover comes from the USGS and EPA. Election-day and lead-up weather come from PRISM 4km daily grids and the NOAA Global Historical Climatology Network. Mail-voting and election-administration patterns come from the MIT Election Lab's Survey of the Performance of American Elections. Block-group crime detail comes from CrimeGrade. Internet data and modeling support provided by ISPreports.org.
Modeling and analysis by the BestNeighborhood data science team. Full methodology and findings: political spectrum map.
Methodology reviewed by the BestNeighborhood data team. Last updated May 2026.