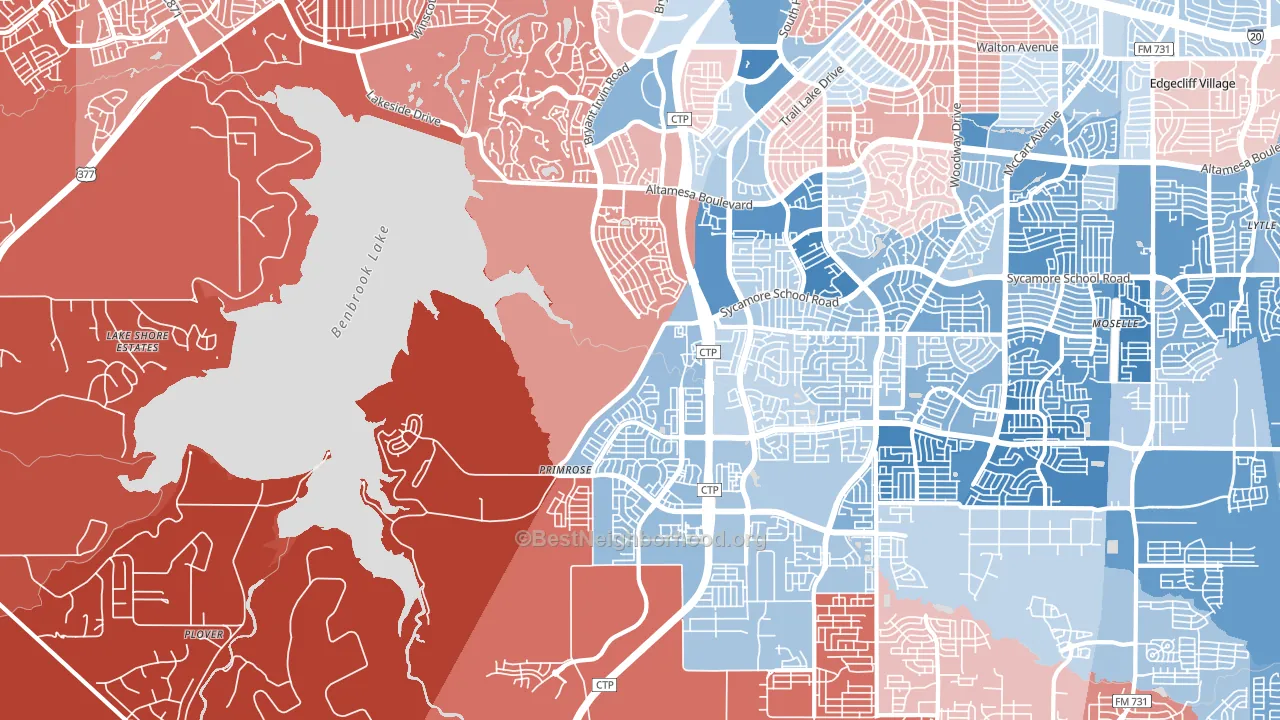
Far Southwest leans slightly Democratic by roughly 10 points: about 55% of voters vote Democratic and 45% Republican.
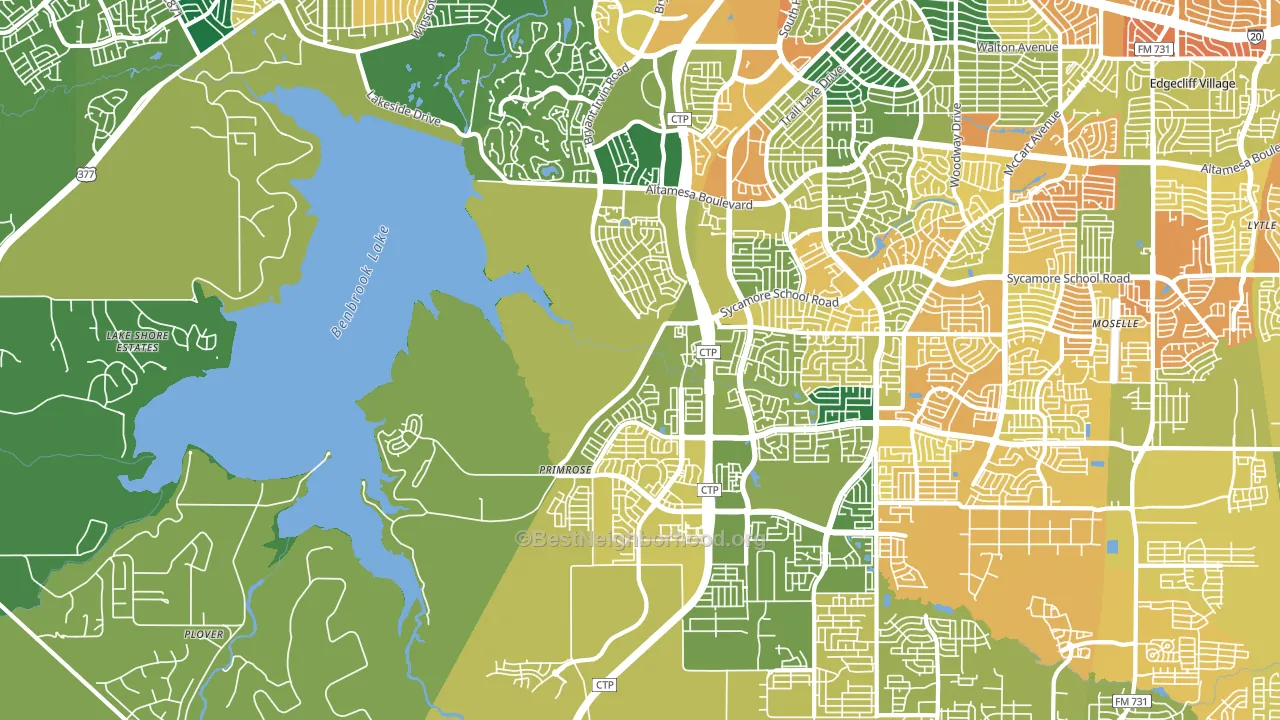
About 74% of adults in Far Southwest typically vote, above the U.S. average of about 62%. Among adults in Far Southwest, ~41% vote Democratic, ~33% Republican, and ~26% don't vote. The map below shows estimated turnout by block group.
How Far Southwest compares
Far Southwest runs about 24 points more Democratic than Texas as a whole. Texas leans Republican overall, while Far Southwest is one of the few Democratic-leaning pockets.
Politics vary noticeably by block within Far Southwest. The northeast side runs the most Democratic (D+39) and the northwest side runs the most Republican (R+41), a spread of about 79 points.
Why Far Southwest leans the way it does
This analysis examined 14,881 data points per neighborhood to find what predicts political lean and turnout. The items below are a few correlations that stood out for Far Southwest, not a ranked or complete list of what matters most.
Far Southwest votes against the grain of Texas. Texas leans Republican overall, while Far Southwest runs about 24 points more Democratic.
Homeownership and voter turnout
Places with homeowner-heavy households tend to turn out at a higher rate; Far Southwest, Fort Worth, TX sits in the top quarter nationally on this measure.
Why turnout in Far Southwest looks the way it does
Homeowners vote more often than renters. About 86% of households in Far Southwest own their home, about 11 points above the Texas average of 75%. Learn more about the findings and methodology on the political spectrum map.
Nearby Neighborhoods
- Wedgwood, Fort Worth, TX D+21
- Far South, Fort Worth, TX D+19
- Sycamore, Fort Worth, TX D+39
- TCU-West Cliff, Fort Worth, TX D+6
- Como, Fort Worth, TX D+65
- Western Hills Fort Worth, Fort Worth, TX D+7
- Southside, Fort Worth, TX D+36
- Fairmount, Fort Worth, TX D+28
- Arlington Heights, Fort Worth, TX D+9
- Far West, Fort Worth, TX R+23
Neighborhoods with Similar Populations
- Clear Lake, Houston, TX R+8
- Allison Hill, Harrisburg, PA D+63
- Upper Eastside, Miami, FL D+25
- Paradise Hills, Henderson, NV R+17
- Admiral, Seattle, WA D+71
- Central Napa, Napa, CA D+39
- Oak Park, San Diego, CA D+30
- Mount Washington, Cincinnati, OH D+13
- Original Daly City, Daly City, CA D+40
- Lodo, Denver, CO D+55
Sources and methodology
Precinct-level voting records used to fit the model come from Texas Secretary of State, Elections Division, distributed by the Voting and Election Science Team. Demographic inputs come from the U.S. Census Bureau (ACS 5-year estimates and the 2020 Decennial Census). Health and environmental inputs come from the CDC (PLACES and the Environmental Justice Index). Land cover comes from the USGS and EPA. Election-day and lead-up weather come from PRISM 4km daily grids and the NOAA Global Historical Climatology Network. Mail-voting and election-administration patterns come from the MIT Election Lab's Survey of the Performance of American Elections. Block-group crime detail comes from CrimeGrade. Internet data and modeling support provided by ISPreports.org.
Modeling and analysis by the BestNeighborhood data science team. Full methodology and findings: political spectrum map.
Methodology reviewed by the BestNeighborhood data team. Last updated May 2026.