Finney is a Democratic stronghold. About 83% of voters here vote Democratic and 17% Republican.
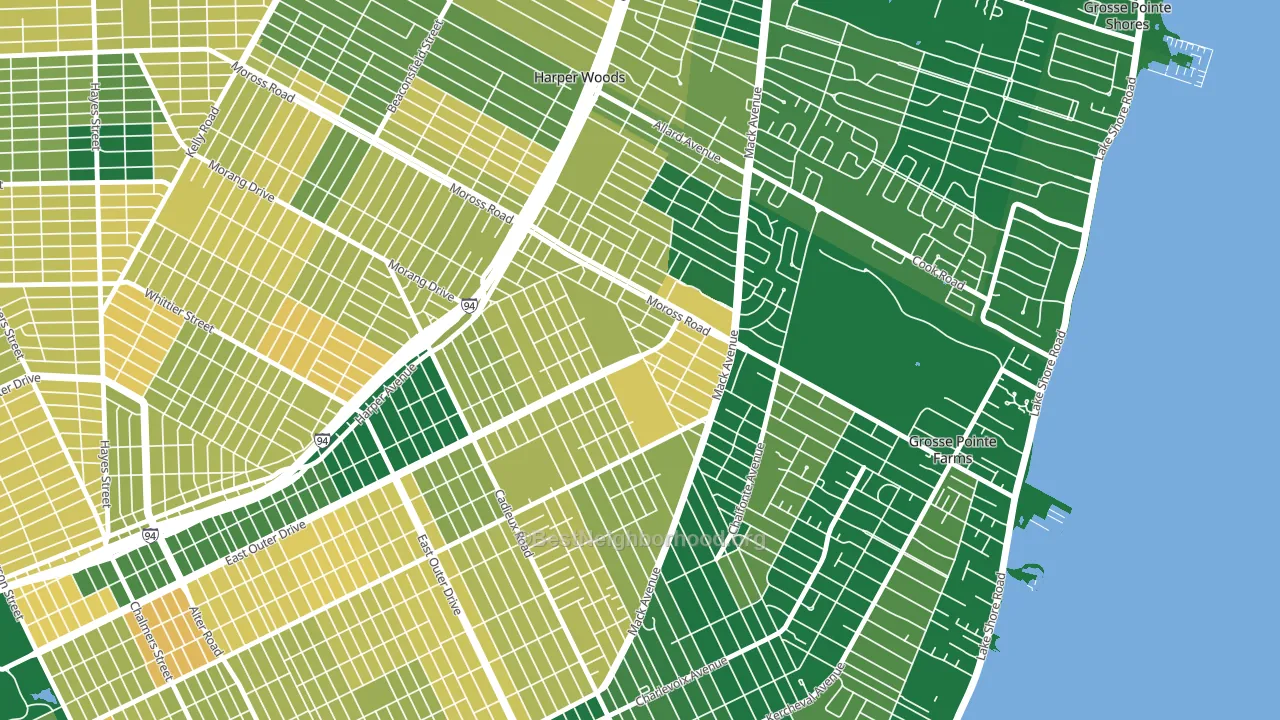
About 74% of adults in Finney typically vote, above the U.S. average of about 62%. Among adults in Finney, ~62% vote Democratic, ~13% Republican, and ~25% don't vote. The map below shows estimated turnout by block group.
How Finney compares
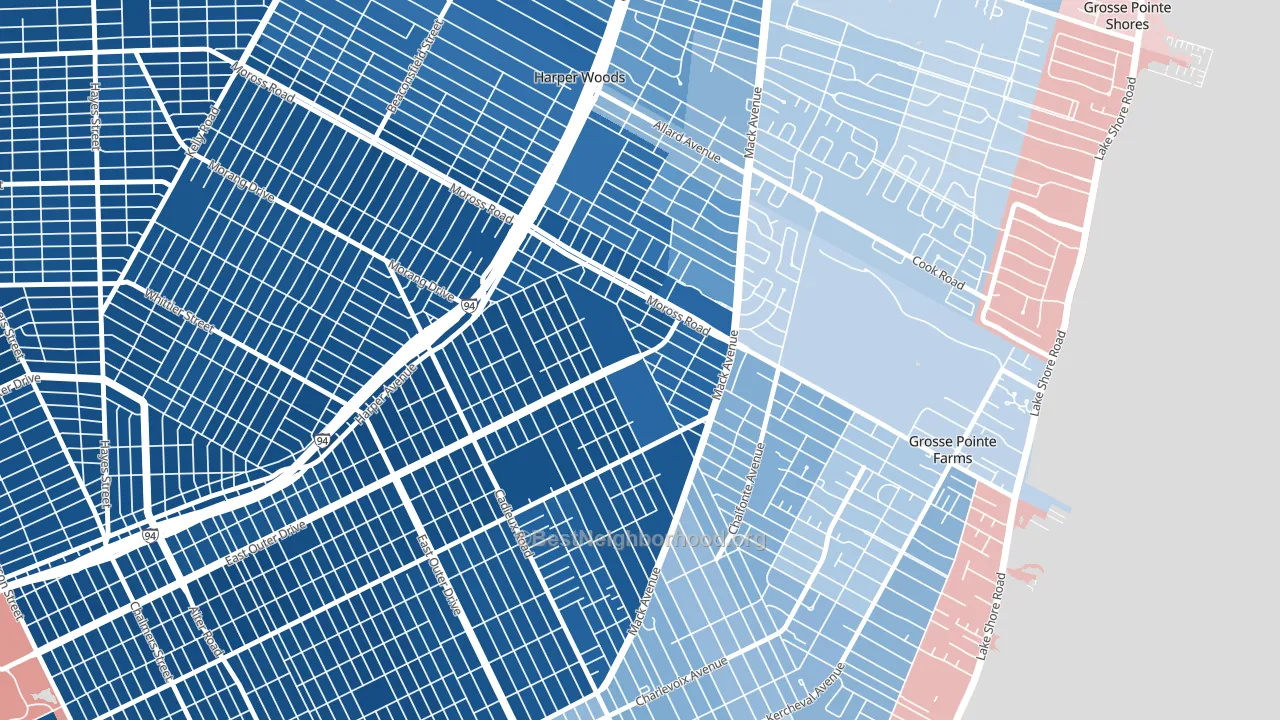
Among neighborhoods within 5 miles, Finney is the least Democratic-leaning.
Finney runs about 67 points more Democratic than Michigan as a whole. Michigan is roughly evenly split, and Finney sits clearly on the Democratic side.
Politics vary noticeably by block within Finney. The west side is the most Democratic-leaning (D+84) and the southeast side is the least Democratic-leaning (D+32), a spread of about 52 points.
Why Finney leans the way it does
This analysis examined 14,881 data points per neighborhood to find what predicts political lean and turnout. The items below are a few correlations that stood out for Finney, not a ranked or complete list of what matters most.
Finney votes against the grain of Michigan. Michigan is roughly evenly split, while Finney runs about 67 points more Democratic. A high never-married share predicts Democratic voting, and about 48% of adults in Finney have never been married, above 78% of neighborhoods.
Population density and Democratic lean
Places with high population density tend to lean Democratic; Finney, Grosse Pointe, MI sits above the national average on this measure.
Why turnout in Finney looks the way it does
Turnout in Finney sits close to the national pattern. Routine healthcare access, homeownership, education, and food security all land near their national averages here. Learn more about the findings and methodology on the political spectrum map.
Nearby Neighborhoods
- East English Village, Detroit, MI D+83
- Yorkshire Woods, Detroit, MI D+85
- Denby, Detroit, MI D+85
- Morningside, Detroit, MI D+85
- Burbank, Detroit, MI D+79
- Chandler Park, Detroit, MI D+87
- Regent Park, Detroit, MI D+85
- Ravendale, Detroit, MI D+86
- Conner, Detroit, MI D+86
- Mohican Regent, Detroit, MI D+85
Neighborhoods with Similar Populations
- Far North Dallas-Justin, Justin, TX R+23
- Houston Suburban Homes, Pasadena, TX R+10
- Winton Hills, Cincinnati, OH D+77
- Comstock, Spokane, WA D+35
- Mosier Valley, Euless, TX D+3
- Crocker, Daly City, CA D+42
- Oak Forest, Charlotte, NC D+65
- Mountain View, Anchorage, AK D+27
- Totem Lake, Kirkland, WA D+40
- Mapleton-Fall Creek, Indianapolis, IN D+73
Sources and methodology
Precinct-level voting records used to fit the model come from Michigan Department of State, Elections, distributed by the Voting and Election Science Team. Demographic inputs come from the U.S. Census Bureau (ACS 5-year estimates and the 2020 Decennial Census). Health and environmental inputs come from the CDC (PLACES and the Environmental Justice Index). Land cover comes from the USGS and EPA. Election-day and lead-up weather come from PRISM 4km daily grids and the NOAA Global Historical Climatology Network. Mail-voting and election-administration patterns come from the MIT Election Lab's Survey of the Performance of American Elections. Block-group crime detail comes from CrimeGrade. Internet data and modeling support provided by ISPreports.org.
Modeling and analysis by the BestNeighborhood data science team. Full methodology and findings: political spectrum map.
Methodology reviewed by the BestNeighborhood data team. Last updated May 2026.