Yorkshire Woods is a Democratic stronghold. About 93% of voters here vote Democratic and 7% Republican.
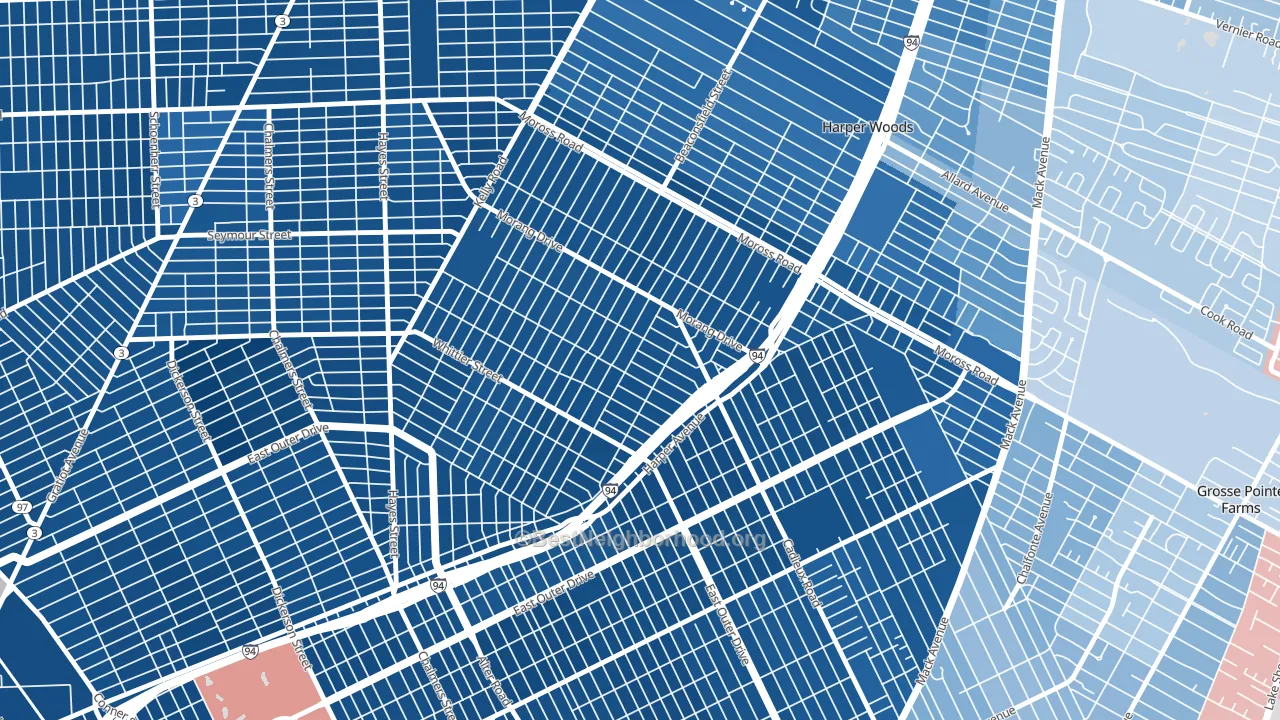
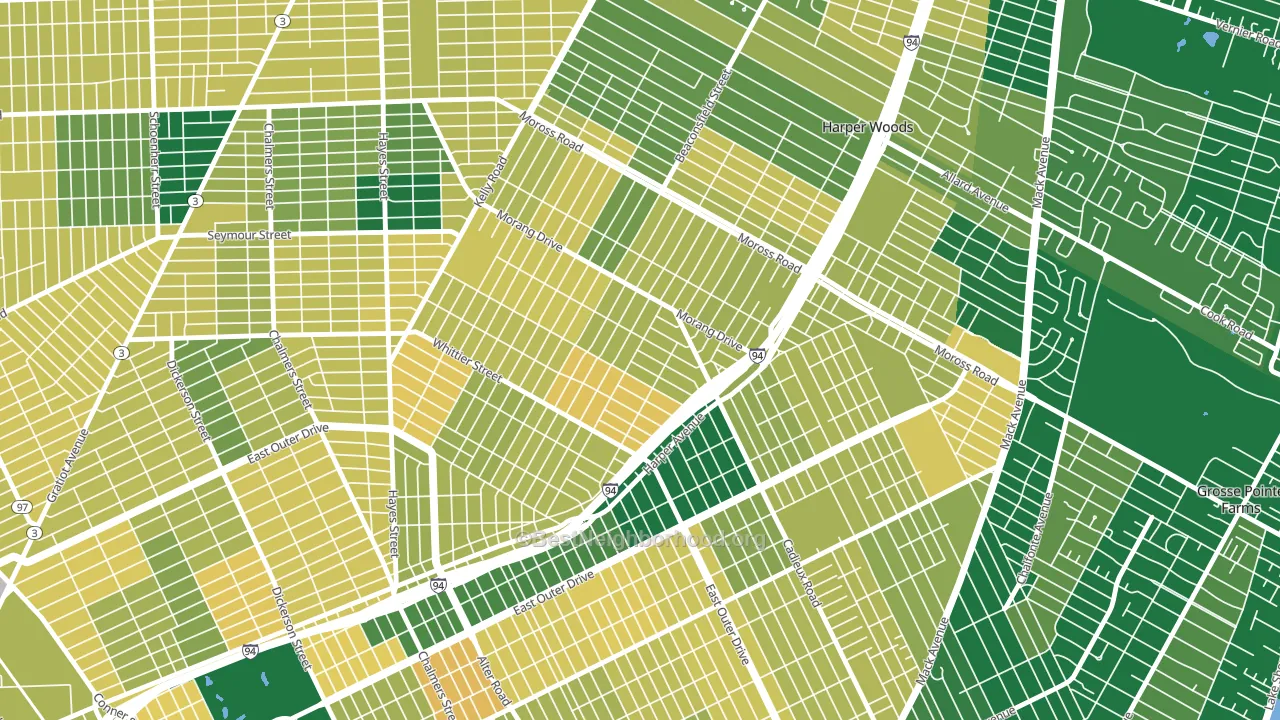
About 59% of adults in Yorkshire Woods typically vote, near the U.S. average of about 62%. Among adults in Yorkshire Woods, ~55% vote Democratic, ~4% Republican, and ~41% don't vote. The map below shows estimated turnout by block group.
How Yorkshire Woods compares
Among neighborhoods within 5 miles, Yorkshire Woods leans more Democratic than 6 of 17 neighbors.
Yorkshire Woods runs about 86 points more Democratic than Michigan as a whole. Michigan is roughly evenly split, and Yorkshire Woods sits clearly on the Democratic side.
Why Yorkshire Woods leans the way it does
This analysis examined 14,881 data points per neighborhood to find what predicts political lean and turnout. The items below are a few correlations that stood out for Yorkshire Woods, not a ranked or complete list of what matters most.
Density combined with diversity predicts Democratic voting. Non-Hispanic white share in Yorkshire Woods is about 3%, about 69 points below the U.S. average of 72%. A high never-married share predicts Democratic voting, and about 55% of adults in Yorkshire Woods have never been married, above 88% of neighborhoods. Yorkshire Woods runs against the grain of Michigan, a Democratic-leaning outlier in a roughly evenly split state.
Paved land cover and Democratic lean
Places with extensive paved surfaces tend to lean Democratic; Yorkshire Woods, Detroit, MI sits in the top quarter nationally on this measure. Paved ground does not change how people vote; it mostly reflects how urban and built-up a place is.
Why turnout in Yorkshire Woods looks the way it does
Areas with high food insecurity turn out at lower rates. About 58% of adults in Yorkshire Woods report food insecurity, about 42 points above the U.S. average of 16%. Low high-school completion lines up with lower turnout, and about 76% of adults in Yorkshire Woods have completed high school, below 90% of neighborhoods. High-crime urban areas turn out at lower rates, and Yorkshire Woods sits in the top 15% on a violent-crime measure. Learn more about the findings and methodology on the political spectrum map.
Nearby Neighborhoods
Neighborhoods with Similar Populations
- Pulaski Park, Hammond, IN D+18
- Linda Mar, Pacifica, CA D+39
- Golf Course Terrace, Sacramento, CA D+42
- Blue Hills, Kansas City, MO D+83
- North, Helena, MT R+3
- Saint Claire-Superior, Cleveland, OH D+76
- South Fountain Avenue Historic District, Springfield, OH D+40
- Sheraden, Pittsburgh, PA D+49
- Village West, Fargo, ND D+4
- Hanamaulu, Lihue, HI D+13
Sources and methodology
Precinct-level voting records used to fit the model come from Michigan Department of State, Elections, distributed by the Voting and Election Science Team. Demographic inputs come from the U.S. Census Bureau (ACS 5-year estimates and the 2020 Decennial Census). Health and environmental inputs come from the CDC (PLACES and the Environmental Justice Index). Land cover comes from the USGS and EPA. Election-day and lead-up weather come from PRISM 4km daily grids and the NOAA Global Historical Climatology Network. Mail-voting and election-administration patterns come from the MIT Election Lab's Survey of the Performance of American Elections. Block-group crime detail comes from CrimeGrade. Internet data and modeling support provided by ISPreports.org.
Modeling and analysis by the BestNeighborhood data science team. Full methodology and findings: political spectrum map.
Methodology reviewed by the BestNeighborhood data team. Last updated May 2026.