Forest County leans Republican by roughly 24 points: about 38% of voters vote Democratic and 62% Republican.
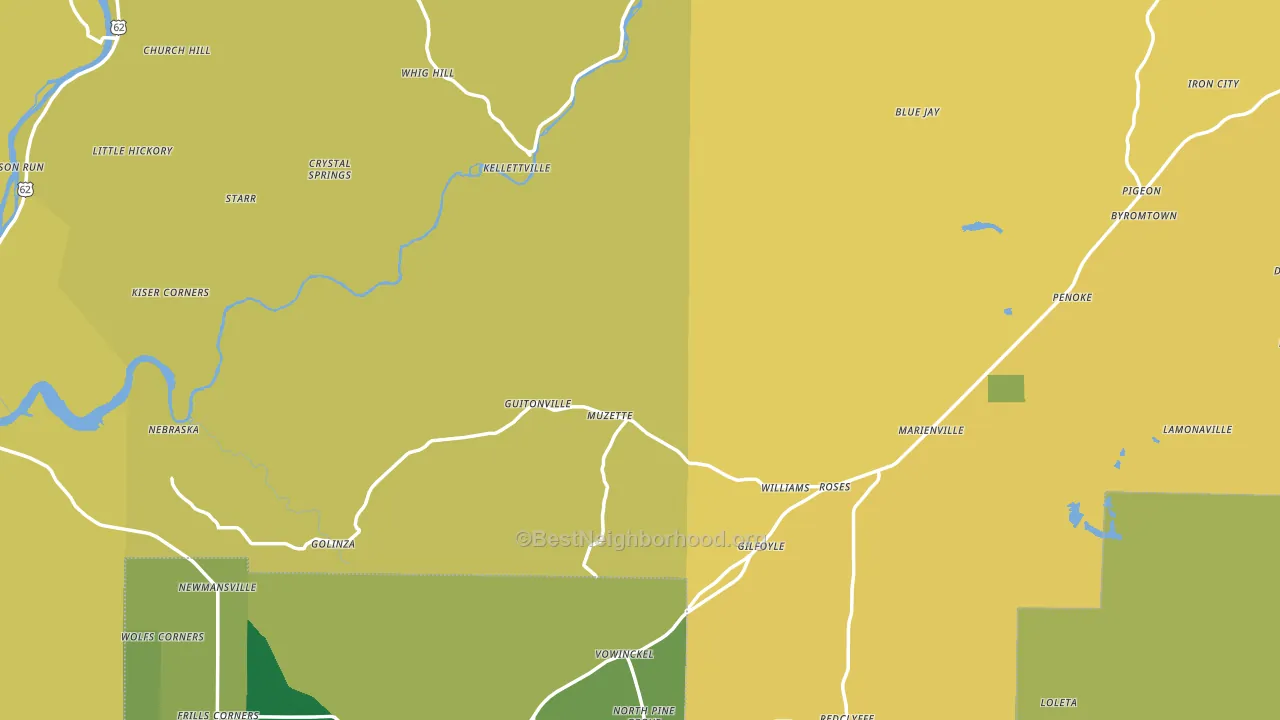
About 59% of adults in Forest County typically vote, near the U.S. average of about 62%. Among adults in Forest County, ~22% vote Democratic, ~37% Republican, and ~41% don't vote. The map below shows estimated turnout by block group.
How Forest County compares
Among counties within 50 miles, Forest County is the least Republican-leaning.
Forest County runs about 22 points more Republican than Pennsylvania as a whole.
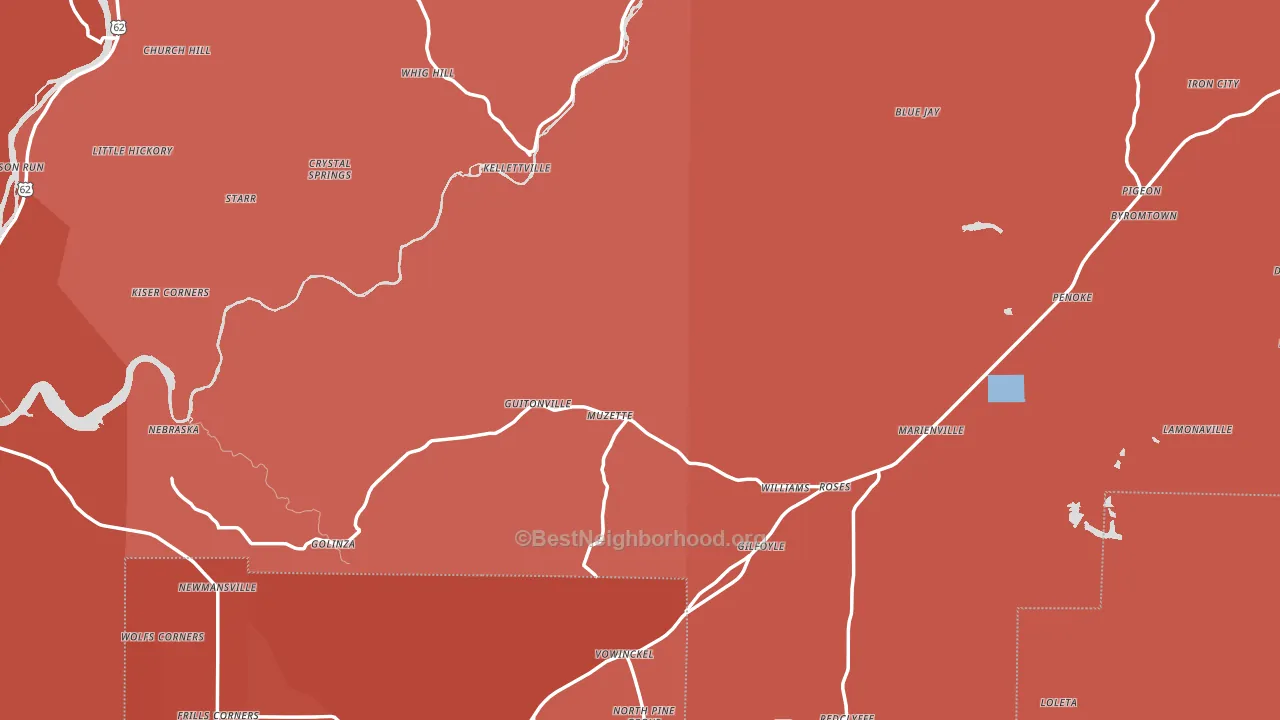
Politics vary noticeably by city within Forest County. The east side is the most split-leaning (R+52) and the southeast side is the least split-leaning (Even), a spread of about 51 points.
Why Forest County leans the way it does
This analysis examined 14,881 data points per county to find what predicts political lean and turnout. The items below are a few correlations that stood out for Forest County, not a ranked or complete list of what matters most.
Areas with low college attainment vote Republican. About 12% of adults in Forest County hold a bachelor's degree, about 14 points below the Pennsylvania average of 26%.
Cancer-screening access and voter turnout
Places with low colon-cancer-screening access tend to turn out at a lower rate; Forest County, PA sits below the national average on this measure. Cancer screening does not drive turnout; it reflects income, insurance, and healthcare access.
Why turnout in Forest County looks the way it does
Low high-school completion lines up with lower turnout, and about 85% of adults in Forest County have completed high school, below 80% of counties. Learn more about the findings and methodology on the political spectrum map.
Nearby Counties
- Clarion County, PA R+50
- Warren County, PA R+41
- Venango County, PA R+42
- Jefferson County, PA R+55
- Elk County, PA R+42
- McKean County, PA R+43
- Crawford County, PA R+39
- Clearfield County, PA R+46
- Cameron County, PA R+47
- Armstrong County, PA R+52
Counties with Similar Populations
- Fall River County, SD R+52
- Swisher County, TX R+48
- Tillman County, OK R+55
- Powell County, MT R+48
- Bon Homme County, SD R+58
- Lake County, TN R+37
- Ida County, IA R+57
- Goliad County, TX R+60
- Caribou County, ID R+73
- Shannon County, MO R+68
Sources and methodology
Precinct-level voting records used to fit the model come from Pennsylvania Department of State, Bureau of Elections, distributed by the Voting and Election Science Team. Demographic inputs come from the U.S. Census Bureau (ACS 5-year estimates and the 2020 Decennial Census). Health and environmental inputs come from the CDC (PLACES and the Environmental Justice Index). Land cover comes from the USGS and EPA. Election-day and lead-up weather come from PRISM 4km daily grids and the NOAA Global Historical Climatology Network. Mail-voting and election-administration patterns come from the MIT Election Lab's Survey of the Performance of American Elections. Block-group crime detail comes from CrimeGrade. Internet data and modeling support provided by ISPreports.org.
Modeling and analysis by the BestNeighborhood data science team. Full methodology and findings: political spectrum map.
Methodology reviewed by the BestNeighborhood data team. Last updated May 2026.