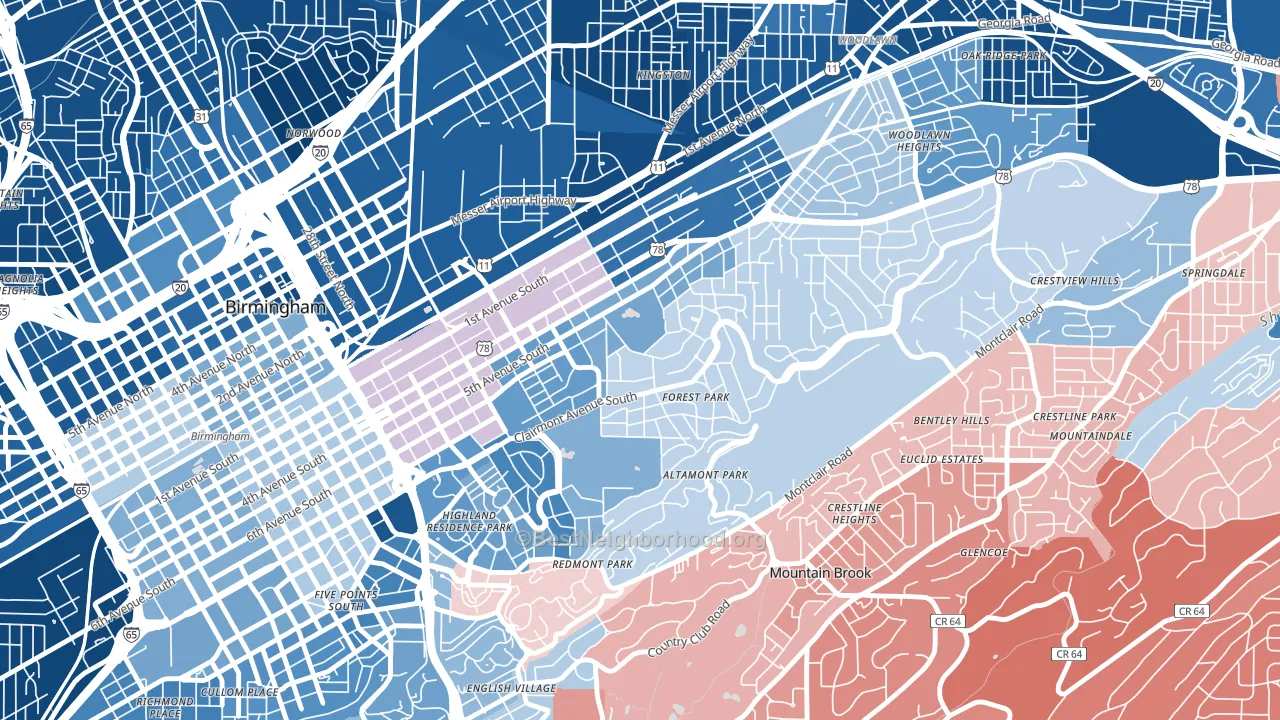
Forest Park leans Democratic by roughly 28 points: about 64% of voters vote Democratic and 36% Republican.
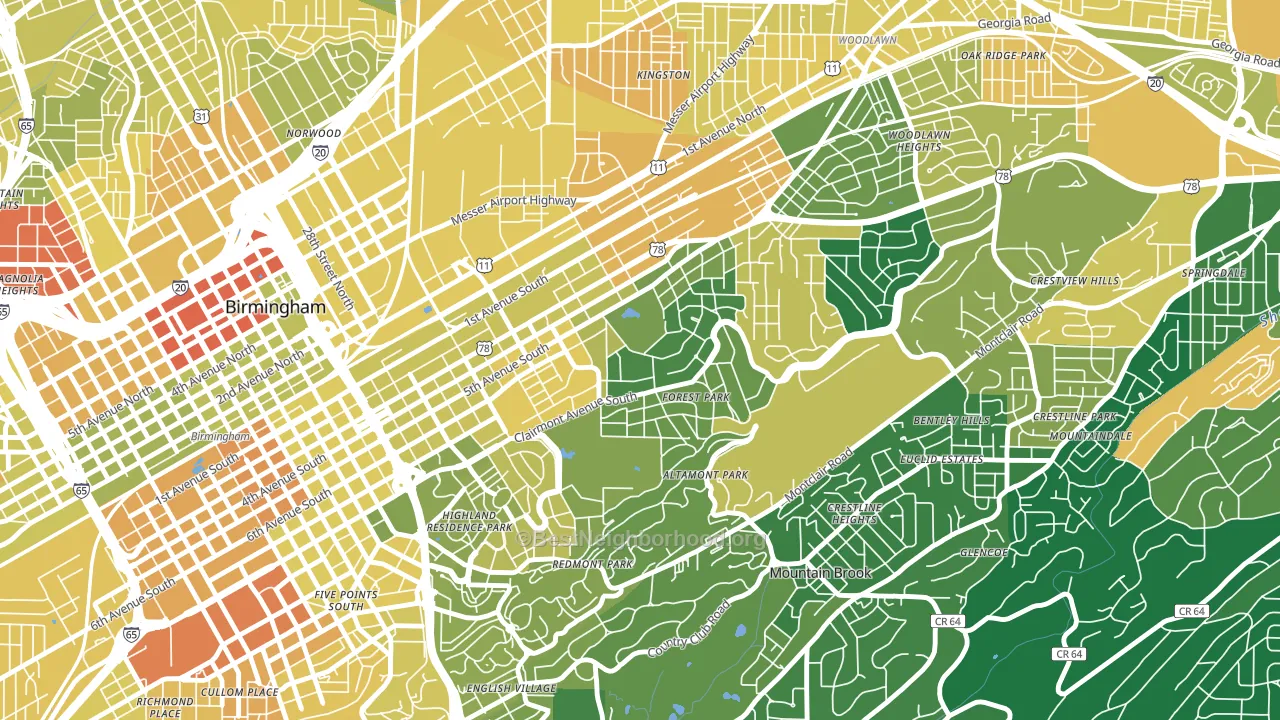
About 65% of adults in Forest Park typically vote, near the U.S. average of about 62%. Among adults in Forest Park, ~42% vote Democratic, ~23% Republican, and ~35% don't vote. The map below shows estimated turnout by block group.
How Forest Park compares
Among neighborhoods within 5 miles, Forest Park leans more Democratic than 2 of 9 neighbors.
Forest Park runs about 59 points more Democratic than Alabama as a whole. Alabama leans Republican overall, while Forest Park is one of the few Democratic-leaning pockets.
Politics vary noticeably by block within Forest Park. The north side is the most Democratic-leaning (D+52) and the east side is the least Democratic-leaning (D+12), a spread of about 40 points.
Why Forest Park leans the way it does
This analysis examined 14,881 data points per neighborhood to find what predicts political lean and turnout. The items below are a few correlations that stood out for Forest Park, not a ranked or complete list of what matters most.
Areas with high college attainment vote Democratic. About 69% of adults in Forest Park hold a bachelor's degree, about 40 points above the U.S. average of 28%. Forest Park runs against the grain of Alabama, a Democratic-leaning pocket in a Republican-leaning state.
High-school completion, uninsured rate, and voter turnout
Places that combine high-school-completion-heavy adults and a low uninsured rate tend to turn out at a higher rate, as Forest Park, Birmingham, AL does.
Why turnout in Forest Park looks the way it does
Areas with strong routine healthcare access turn out at higher rates. Forest Park is in the top quarter nationally for routine-care measures such as insurance coverage, preventive screenings, and dental visits. The dental-visit rate here is about 65%, about 5 points above the U.S. average of 60%. Learn more about the findings and methodology on the political spectrum map.
Nearby Neighborhoods
- Highland Park, Birmingham, AL D+36
- Southside, Birmingham, AL D+42
- Redmont Park, Birmingham, AL R+10
- Crestline, Birmingham, AL Even
- Norwood, Birmingham, AL D+74
- Five Points South, Birmingham, AL D+44
- Glen Iris, Birmingham, AL D+56
- South East Lake, Birmingham, AL D+71
- Arlington, Birmingham, AL D+90
- Crossgate, Vestavia Hills, AL R+4
Neighborhoods with Similar Populations
- 1st Ward, Allentown, PA D+30
- School Gardens, Riviera Beach, MD R+19
- Cherry Grove, Cincinnati, OH R+4
- McIntire Terrace Historic District, Zanesville, OH R+12
- Northside, Missoula, MT D+34
- Fisher-Mill Plain-Fisher's Village, Vancouver, WA D+3
- Payette Heights, Payette, ID R+51
- Chandler Park, Detroit, MI D+87
- Lower Clinton Hill, Newark, NJ D+79
- East Winston, Winston-Salem, NC D+82
Sources and methodology
Precinct-level voting records used to fit the model come from Alabama Secretary of State, Elections, distributed by the Voting and Election Science Team. Demographic inputs come from the U.S. Census Bureau (ACS 5-year estimates and the 2020 Decennial Census). Health and environmental inputs come from the CDC (PLACES and the Environmental Justice Index). Land cover comes from the USGS and EPA. Election-day and lead-up weather come from PRISM 4km daily grids and the NOAA Global Historical Climatology Network. Mail-voting and election-administration patterns come from the MIT Election Lab's Survey of the Performance of American Elections. Block-group crime detail comes from CrimeGrade. Internet data and modeling support provided by ISPreports.org.
Modeling and analysis by the BestNeighborhood data science team. Full methodology and findings: political spectrum map.
Methodology reviewed by the BestNeighborhood data team. Last updated May 2026.