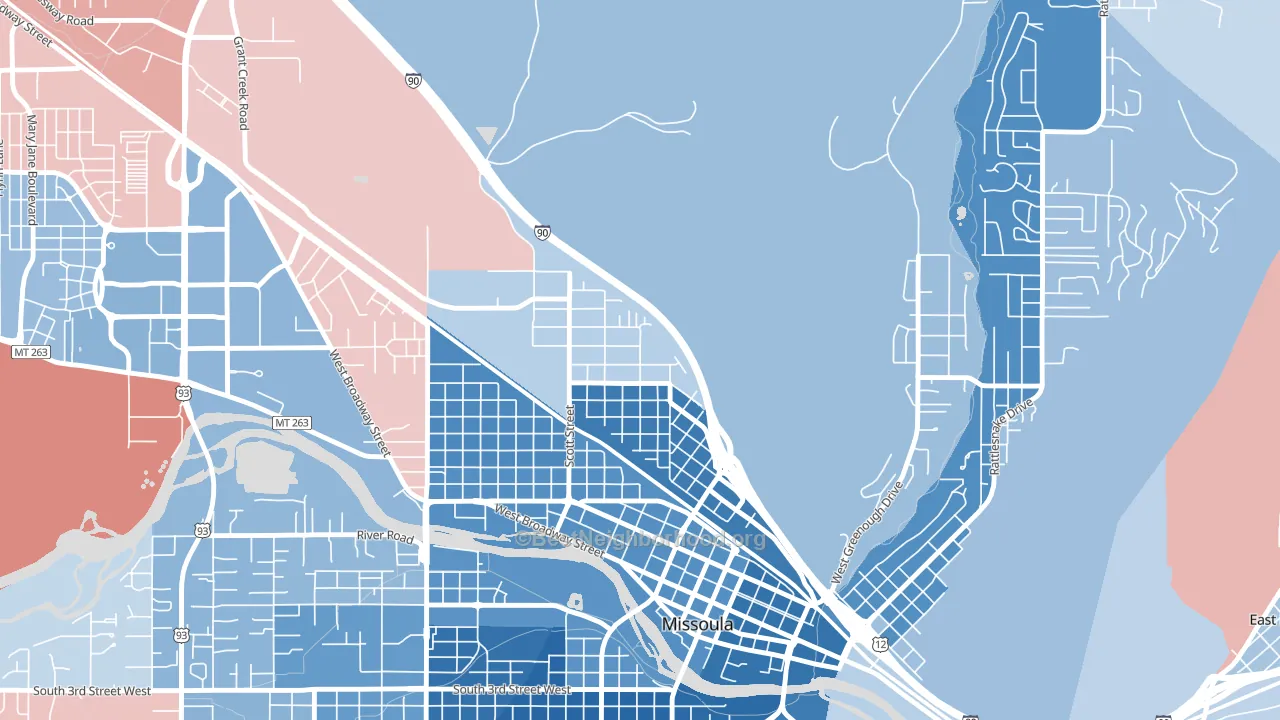
Northside leans heavily Democratic by roughly 34 points: about 67% of voters vote Democratic and 33% Republican.
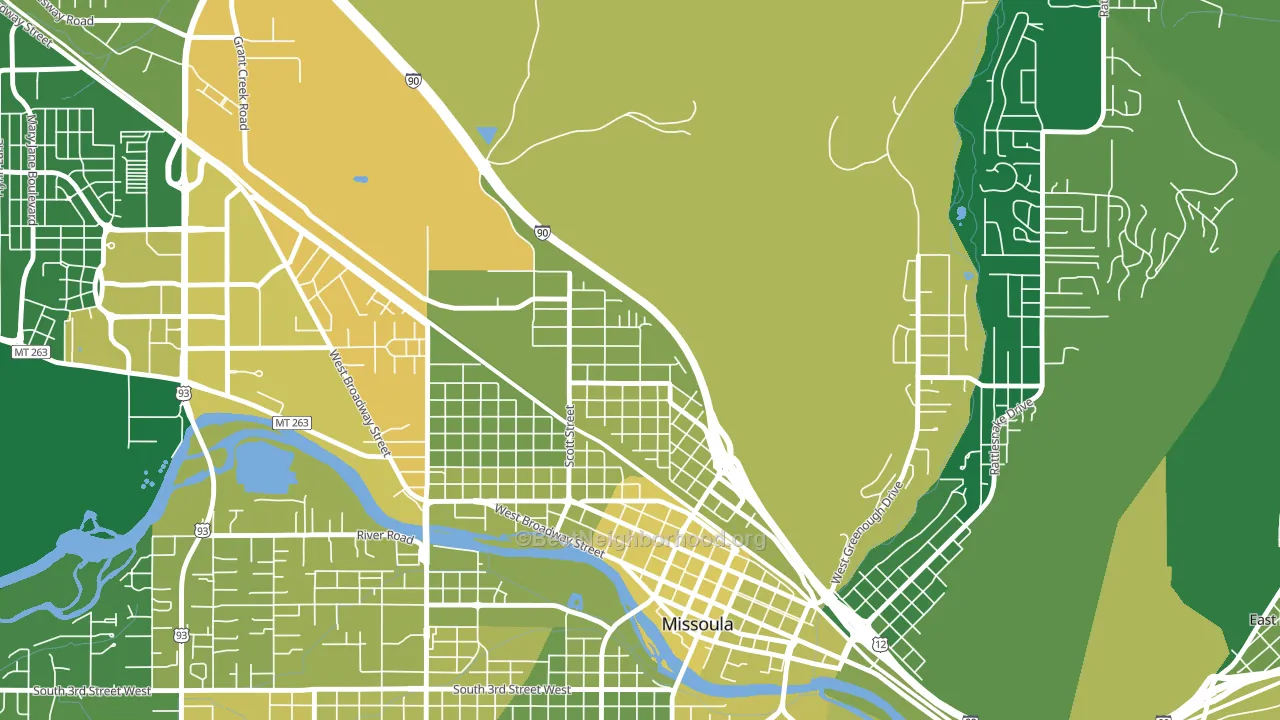
About 70% of adults in Northside typically vote, above the U.S. average of about 62%. Among adults in Northside, ~47% vote Democratic, ~23% Republican, and ~30% don't vote. The map below shows estimated turnout by block group.
How Northside compares
Among neighborhoods within 5 miles, Northside leans more Democratic than 6 of 12 neighbors.
Northside runs about 54 points more Democratic than Montana as a whole. Montana leans Republican overall, while Northside is one of the few Democratic-leaning pockets.
Politics vary noticeably by block within Northside. The east side is the most Democratic-leaning (D+63) and the northwest side is the least Democratic-leaning (D+8), a spread of about 55 points.
Why Northside leans the way it does
This analysis examined 14,881 data points per neighborhood to find what predicts political lean and turnout. The items below are a few correlations that stood out for Northside, not a ranked or complete list of what matters most.
Northside votes against the grain of Montana. Montana leans Republican overall, while Northside runs about 54 points more Democratic.
High-school completion and voter turnout
Places with high-school-completion-heavy adults tend to turn out at a higher rate; Northside, Missoula, MT sits above the national average on this measure.
Why turnout in Northside looks the way it does
Turnout in Northside sits close to the national pattern. Learn more about the findings and methodology on the political spectrum map.
Nearby Neighborhoods
- Westside, Missoula, MT D+35
- Heart of Missoula, Missoula, MT D+51
- Emma Dickinson Orchard Homes, Missoula, MT D+31
- Upper Rattlesnake, Missoula, MT D+47
- Rose Park, Missoula, MT D+59
- University District, Missoula, MT D+59
- Franklin To The Fort, Missoula, MT D+29
- Captain John Mullan, Missoula, MT D+12
- Lewis and Clark, Missoula, MT D+47
- Southgate Triangle, Missoula, MT D+26
Neighborhoods with Similar Populations
- Fisher-Mill Plain-Fisher's Village, Vancouver, WA D+3
- Southdale, Edina, MN D+48
- Lower Clinton Hill, Newark, NJ D+79
- Chandler Park, Detroit, MI D+87
- Cannongate-Orlando, Oak Ridge, FL D+33
- Mayo Meadow, Tulsa, OK D+18
- Ashbrook-Clawson Village, Charlotte, NC D+27
- 1st Ward, Allentown, PA D+30
- Forest Park, Birmingham, AL D+28
- School Gardens, Riviera Beach, MD R+19
Sources and methodology
Precinct-level voting records used to fit the model come from Montana Secretary of State, Elections, distributed by the Voting and Election Science Team. Demographic inputs come from the U.S. Census Bureau (ACS 5-year estimates and the 2020 Decennial Census). Health and environmental inputs come from the CDC (PLACES and the Environmental Justice Index). Land cover comes from the USGS and EPA. Election-day and lead-up weather come from PRISM 4km daily grids and the NOAA Global Historical Climatology Network. Mail-voting and election-administration patterns come from the MIT Election Lab's Survey of the Performance of American Elections. Block-group crime detail comes from CrimeGrade. Internet data and modeling support provided by ISPreports.org.
Modeling and analysis by the BestNeighborhood data science team. Full methodology and findings: political spectrum map.
Methodology reviewed by the BestNeighborhood data team. Last updated May 2026.