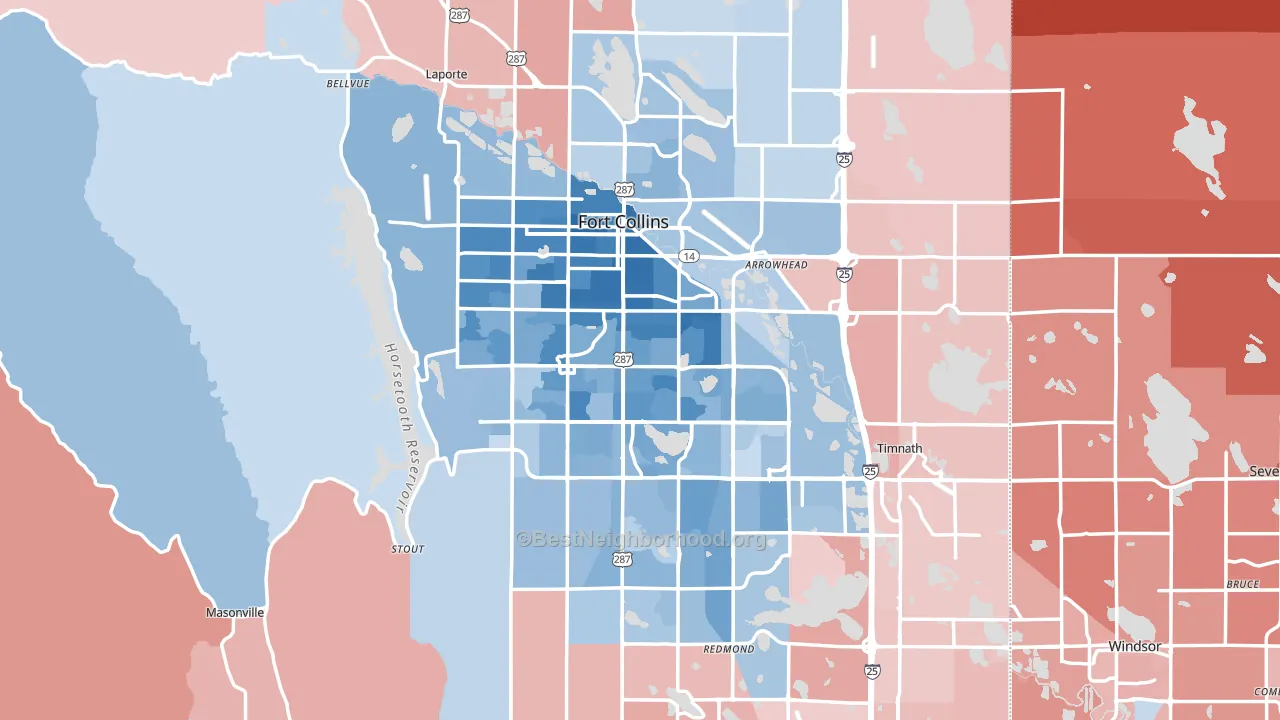
Fort Collins leans heavily Democratic by roughly 32 points: about 66% of voters vote Democratic and 34% Republican.
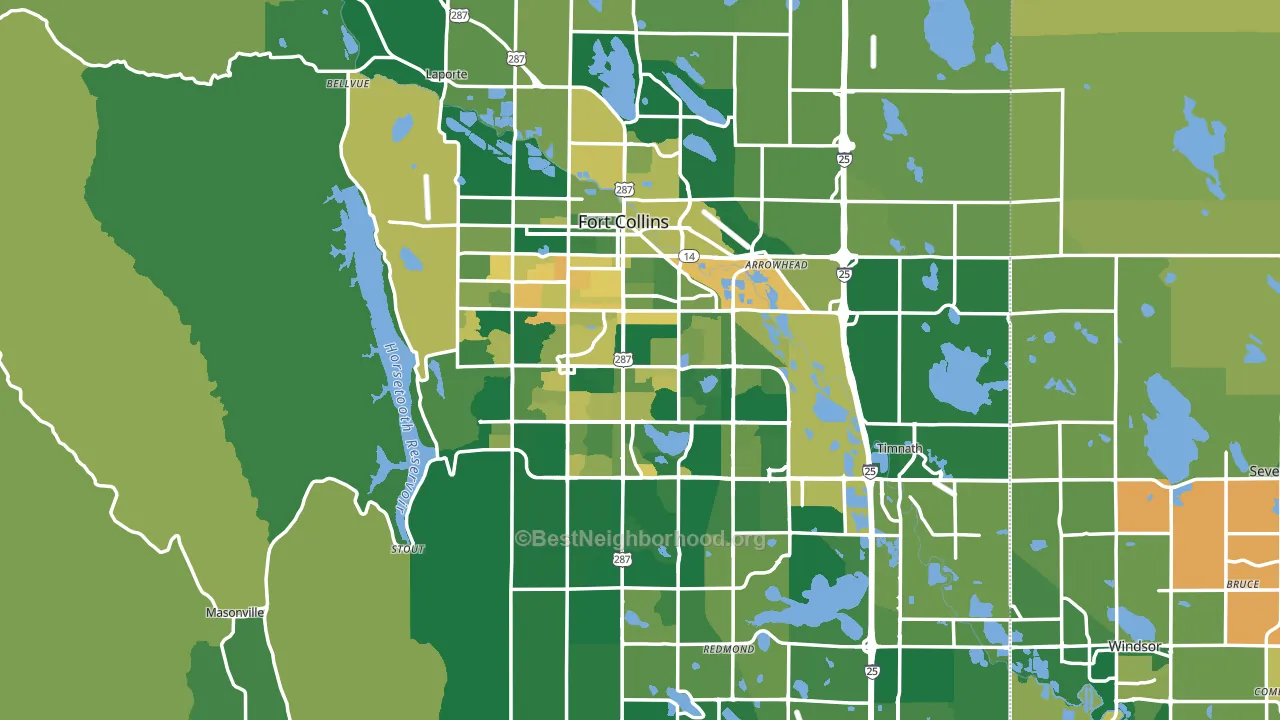
About 80% of adults in Fort Collins typically vote, above the U.S. average of about 62%. Among adults in Fort Collins, ~53% vote Democratic, ~27% Republican, and ~20% don't vote. The map below shows estimated turnout by block group.
How Fort Collins compares
Among cities within 25 miles, Fort Collins is the most Democratic-leaning.
Fort Collins runs about 21 points more Democratic than Colorado as a whole.
Politics vary noticeably by neighborhood within Fort Collins. The west side is the most Democratic-leaning (D+45) and the northeast side is the least Democratic-leaning (D+14), a spread of about 31 points.
Why Fort Collins leans the way it does
This analysis examined 14,881 data points per city to find what predicts political lean and turnout. The items below are a few correlations that stood out for Fort Collins, not a ranked or complete list of what matters most.
Areas with high college attainment vote Democratic. About 60% of adults in Fort Collins hold a bachelor's degree, about 31 points above the U.S. average of 28%. Dense areas vote Democratic, and Fort Collins sits in the top fifth on density (about 80%, above 94% of cities). A high never-married share predicts Democratic voting, and about 42% of adults in Fort Collins have never been married, above 95% of cities.
Paved land cover and Democratic lean
Places with extensive paved surfaces tend to lean Democratic; Fort Collins, CO sits in the top tenth nationally on this measure. Paved ground does not change how people vote; it mostly reflects how urban and built-up a place is.
Why turnout in Fort Collins looks the way it does
Areas with high high-school completion turn out at higher rates. About 97% of adults in Fort Collins have completed high school, about 7 points above the U.S. average of 90%. Learn more about the findings and methodology on the political spectrum map.
Nearby Cities
- Timnath, CO R+4
- Laporte, CO D+2
- Windsor, CO R+18
- Loveland, CO Even
- Wellington, CO R+23
- Severance, CO R+29
- Cedar Cove, CO R+17
- Bellvue, CO D+16
- Masonville, CO R+18
- Olympus Heights, CO R+22
Cities with Similar Populations
- Elk Grove, CA D+19
- Peoria, AZ R+16
- Kissimmee, FL D+3
- Sioux Falls, SD R+5
- Cape Coral, FL R+29
- Huntington Beach, CA R+4
- Sunrise Manor, NV D+20
- Salem, OR D+13
- Wilmington, DE D+39
- Grand Prairie, TX D+22
Sources and methodology
Precinct-level voting records used to fit the model come from Colorado Secretary of State, Elections, distributed by the Voting and Election Science Team. Demographic inputs come from the U.S. Census Bureau (ACS 5-year estimates and the 2020 Decennial Census). Health and environmental inputs come from the CDC (PLACES and the Environmental Justice Index). Land cover comes from the USGS and EPA. Election-day and lead-up weather come from PRISM 4km daily grids and the NOAA Global Historical Climatology Network. Mail-voting and election-administration patterns come from the MIT Election Lab's Survey of the Performance of American Elections. Block-group crime detail comes from CrimeGrade. Internet data and modeling support provided by ISPreports.org.
Modeling and analysis by the BestNeighborhood data science team. Full methodology and findings: political spectrum map.
Methodology reviewed by the BestNeighborhood data team. Last updated May 2026.