Germantown leans heavily Democratic by roughly 36 points: about 68% of voters vote Democratic and 32% Republican.
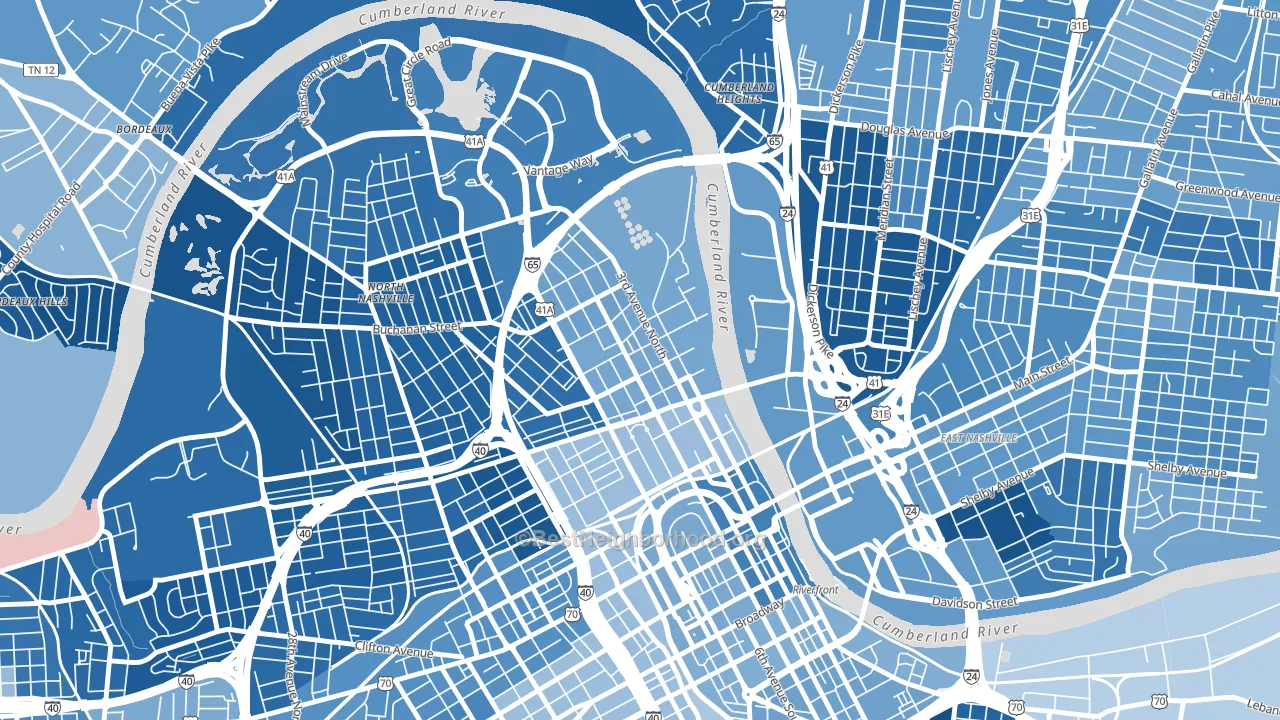
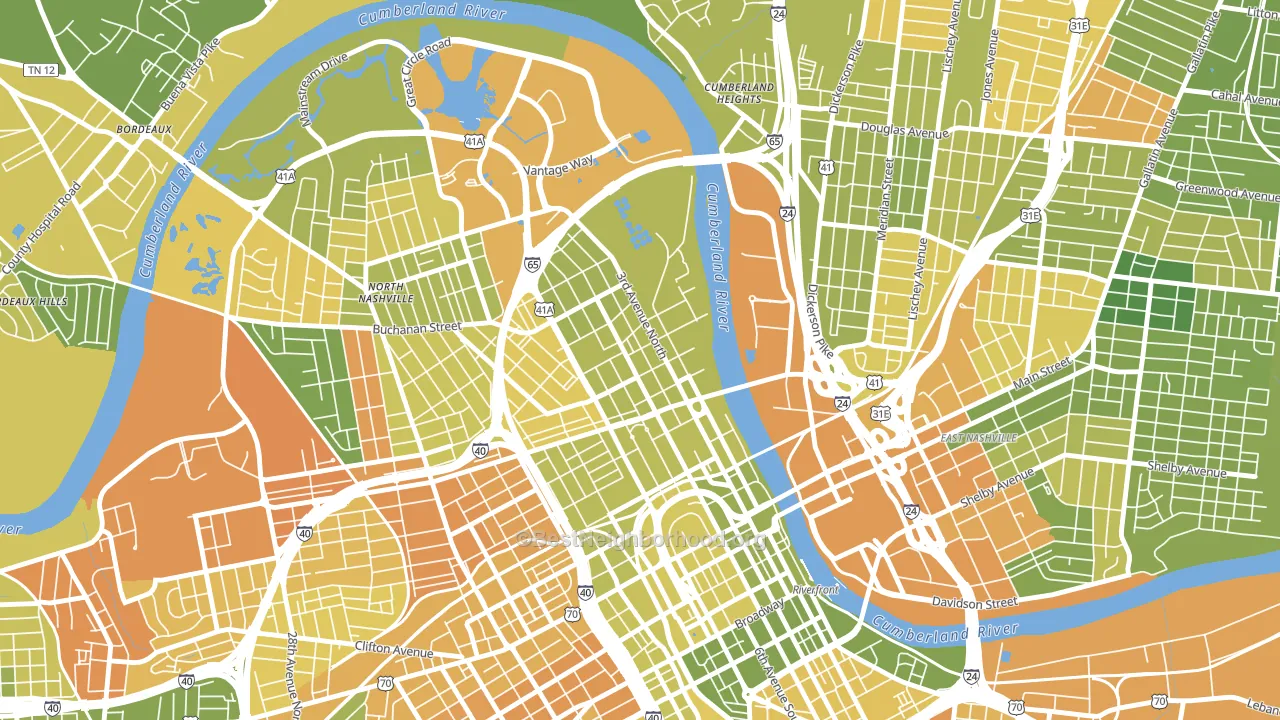
About 60% of adults in Germantown typically vote, near the U.S. average of about 62%. Among adults in Germantown, ~41% vote Democratic, ~19% Republican, and ~40% don't vote. The map below shows estimated turnout by block group.
How Germantown compares
Among neighborhoods within 5 miles, Germantown leans more Democratic than 6 of 25 neighbors.
Germantown runs about 65 points more Democratic than Tennessee as a whole. Tennessee leans Republican overall, while Germantown is one of the few Democratic-leaning pockets.
Why Germantown leans the way it does
This analysis examined 14,881 data points per neighborhood to find what predicts political lean and turnout. The items below are a few correlations that stood out for Germantown, not a ranked or complete list of what matters most.
Areas with high college attainment vote Democratic. About 85% of adults in Germantown hold a bachelor's degree, about 56 points above the U.S. average of 28%. A high never-married share predicts Democratic voting, and about 56% of adults in Germantown have never been married, above 89% of neighborhoods. Germantown runs against the grain of Tennessee, a Democratic-leaning pocket in a Republican-leaning state.
Walkability and Democratic lean
Places with a highly walkable street grid tend to lean Democratic; Germantown, Nashville, TN sits in the top tenth nationally on this measure. A walkable street grid does not change how people vote; it mostly reflects how urban a place is.
Why turnout in Germantown looks the way it does
Renters vote less often than owners. About 76% of households in Germantown rent, about 51 points above the U.S. average of 25%. High-crime urban areas turn out at lower rates, and Germantown sits in the top 15% on a violent-crime measure. Learn more about the findings and methodology on the political spectrum map.
Nearby Neighborhoods
- Downtown Nashville, Nashville, TN D+50
- Fisk-Meharry, Nashville, TN D+70
- McFerrin Park, Nashville, TN D+71
- The Gulch, Nashville, TN D+11
- Historic Edgefield, Nashville, TN D+60
- Midtown-Nashville, Nashville, TN D+32
- Vanderbilt-West End, Nashville, TN D+54
- Edgehill, Nashville, TN D+64
- Haynes Area, Nashville, TN D+81
- Talbot's Corner, Nashville, TN D+59
Neighborhoods with Similar Populations
- Apple Creek, San Antonio, TX D+26
- Riverside Heights, Tampa, FL D+21
- Duveneck-Saint Francis, Palo Alto, CA D+44
- West Mt. Scott, Happy Valley, OR D+23
- Bywater, New Orleans, LA D+63
- Clarksville, Austin, TX D+58
- Mount Vernon, San Bernardino, CA D+37
- Brooklands Park, Rochester Hills, MI R+4
- Echo Highlands, Birmingham, AL D+77
- White Grove, Fort Mill, SC R+20
Sources and methodology
Precinct-level voting records used to fit the model come from Tennessee Secretary of State, Division of Elections, distributed by the Voting and Election Science Team. Demographic inputs come from the U.S. Census Bureau (ACS 5-year estimates and the 2020 Decennial Census). Health and environmental inputs come from the CDC (PLACES and the Environmental Justice Index). Land cover comes from the USGS and EPA. Election-day and lead-up weather come from PRISM 4km daily grids and the NOAA Global Historical Climatology Network. Mail-voting and election-administration patterns come from the MIT Election Lab's Survey of the Performance of American Elections. Block-group crime detail comes from CrimeGrade. Internet data and modeling support provided by ISPreports.org.
Modeling and analysis by the BestNeighborhood data science team. Full methodology and findings: political spectrum map.
Methodology reviewed by the BestNeighborhood data team. Last updated May 2026.