Greater Rosemont is a Democratic stronghold. About 86% of voters here vote Democratic and 14% Republican.
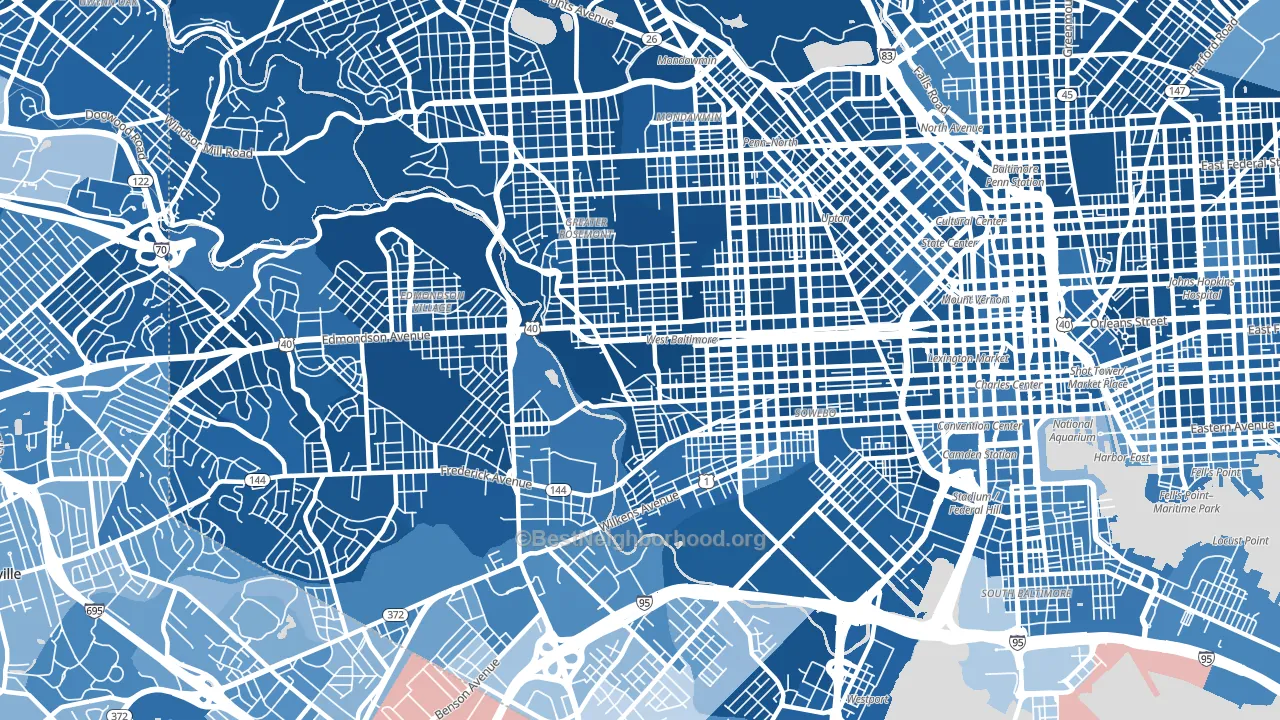
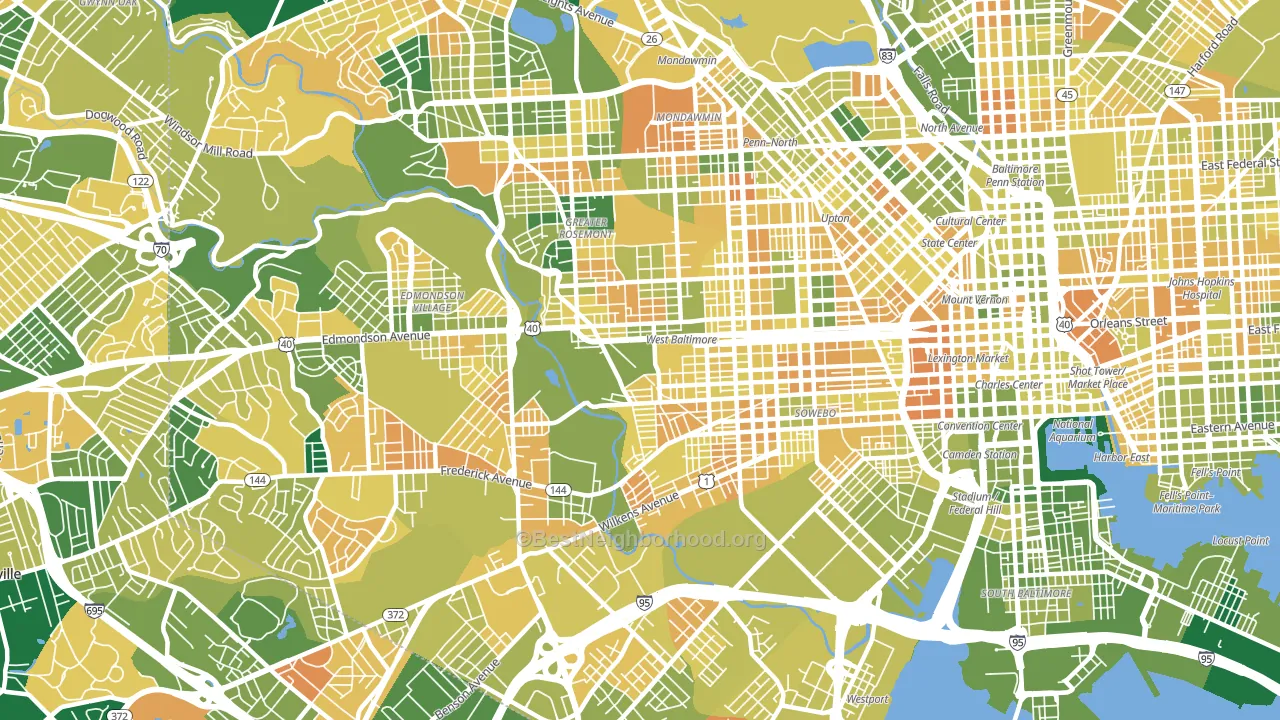
About 59% of adults in Greater Rosemont typically vote, near the U.S. average of about 62%. Among adults in Greater Rosemont, ~51% vote Democratic, ~8% Republican, and ~41% don't vote. The map below shows estimated turnout by block group.
How Greater Rosemont compares
Among neighborhoods within 5 miles, Greater Rosemont leans more Democratic than 16 of 45 neighbors.
Greater Rosemont runs about 43 points more Democratic than Maryland as a whole.
Politics vary noticeably by block within Greater Rosemont. The southwest side is the most Democratic-leaning (D+88) and the southeast side is the least Democratic-leaning (Even), a spread of about 87 points.
Why Greater Rosemont leans the way it does
This analysis examined 14,881 data points per neighborhood to find what predicts political lean and turnout. The items below are a few correlations that stood out for Greater Rosemont, not a ranked or complete list of what matters most.
Areas with many never-married adults vote Democratic. About 53% of adults in Greater Rosemont have never been married, well above similar-sized neighborhoods (around 36%).
Paved land cover and Democratic lean
Places with extensive paved surfaces tend to lean Democratic; Greater Rosemont, Baltimore, MD sits in the top quarter nationally on this measure. Paved ground does not change how people vote; it mostly reflects how urban and built-up a place is.
Why turnout in Greater Rosemont looks the way it does
Areas with high food insecurity turn out at lower rates. About 39% of adults in Greater Rosemont report food insecurity, about 23 points above the U.S. average of 16%. Low high-school completion lines up with lower turnout, and about 82% of adults in Greater Rosemont have completed high school, below 82% of neighborhoods. High-crime urban areas turn out at lower rates, and Greater Rosemont sits in the top 15% on a violent-crime measure. Learn more about the findings and methodology on the political spectrum map.
Nearby Neighborhoods
- West Baltimore, Baltimore, MD D+82
- Sandtown-Winchester, Baltimore, MD D+87
- Beechfielf-Irvington Area, Baltimore, MD D+83
- Washington Village, Baltimore, MD D+75
- Mondawin-Walbrook, Baltimore, MD D+86
- Morrell Park, Baltimore, MD D+22
- Hunting Ridge, Baltimore, MD D+86
- Reservoir Hill-Bolton Hill, Baltimore, MD D+82
- Downtown, Baltimore, MD D+75
- Winsor Hills, Baltimore, MD D+87
Neighborhoods with Similar Populations
- Northwest Colorado Springs, Colorado Springs, CO Even
- Todt Hill, Staten Island, NY R+26
- Rockaway Park, Queens, NY R+8
- Metzger, Tigard, OR D+39
- Au-Tenleytown, Washington, DC D+66
- Whiskey Point, Chicago, IL D+48
- Tule Springs, Las Vegas, NV R+13
- Cully, Portland, OR D+63
- North Cambridge, Cambridge, MA D+71
- Waikiki, Honolulu, HI D+32
Sources and methodology
Precinct-level voting records used to fit the model come from Maryland State Board of Elections, distributed by the Voting and Election Science Team. Demographic inputs come from the U.S. Census Bureau (ACS 5-year estimates and the 2020 Decennial Census). Health and environmental inputs come from the CDC (PLACES and the Environmental Justice Index). Land cover comes from the USGS and EPA. Election-day and lead-up weather come from PRISM 4km daily grids and the NOAA Global Historical Climatology Network. Mail-voting and election-administration patterns come from the MIT Election Lab's Survey of the Performance of American Elections. Block-group crime detail comes from CrimeGrade. Internet data and modeling support provided by ISPreports.org.
Modeling and analysis by the BestNeighborhood data science team. Full methodology and findings: political spectrum map.
Methodology reviewed by the BestNeighborhood data team. Last updated May 2026.